
Power BI vs Tableau 2026: Salary, Jobs & Verdict

If you've typed "power bi vs tableau" into Google in the last month, you already know the search results contradict each other. One blog says Power BI is "obviously better." The next says Tableau "wins on everything that matters." Neither is being straight with you.
Here's the short version before we go deep: Power BI wins on price, job volume, and beginner speed. Tableau wins on visual depth, large-dataset handling, and consulting-heavy salary bands. The right answer depends entirely on which door you're trying to walk through a Microsoft-stack company, or a Salesforce/consulting-heavy one.
This guide breaks down Power BI vs Tableau pricing, the real Power BI vs Tableau salary numbers for 2026, learning curve, AI features, and which tool actually has more job postings right now not vibes, actual numbers pulled from Microsoft, Salesforce/Tableau, Glassdoor, and AmbitionBox data.
Quick Answer: Power BI vs Tableau at a Glance
Numbers shift monthly, treat this table as a directional snapshot, not gospel.
What is Power BI?
Power BI is Microsoft's business intelligence and data visualization platform, now folded into Microsoft Fabric. If you've used Excel, the interface feels familiar within a week: drag a field, pick a chart, and DAX (Data Analysis Expressions) handles the math underneath.
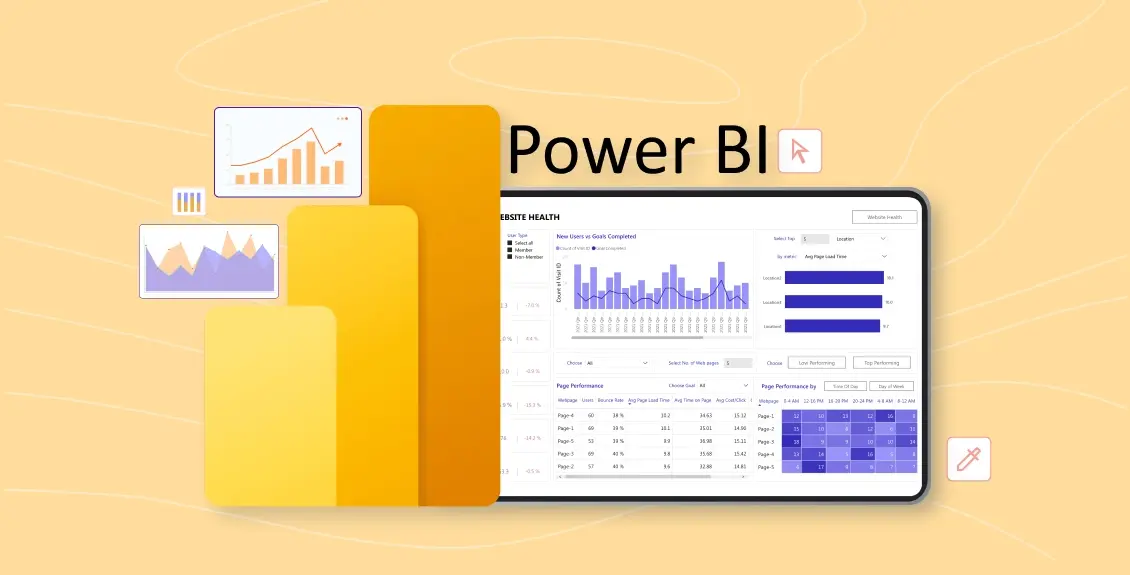
Power BI Desktop is completely free for individual use. You only pay once you want to publish, share, or collaborate on reports through Power BI Pro or Premium.
What is Tableau?
Tableau, owned by Salesforce, runs on VizQL a query engine that converts drag-and-drop actions into database queries in real time. Analysts who need presentation-grade, highly customized dashboards reach for Tableau first, and it handles massive datasets (100M+ rows) with less strain than most tools in its price range.

Unlike Power BI, Tableau has no free private tier. Tableau Public exists, but anything built there is visible to the entire internet.
Power BI vs Tableau Pricing: The Real Gap
This is where the power bi vs tableau pricing comparison stops being close.
For a 50-person analytics team, that's a gap of a few hundred dollars a month versus several thousand. Independent cost modeling from Domo puts a mid-size 500-user organization's 3-year total cost of ownership at $180K-$300K on Power BI versus $450K-$600K on Tableau [2] a difference big enough that most finance teams don't need a second meeting to decide.
That single fact is a huge reason Power BI has become the default across Indian IT-services and BFSI companies: the sign-off is easier.
Power BI vs Tableau: learning curve and daily use
Ask ten working analysts and most say the same thing Power BI is easier to pick up if you already know Excel. The ribbon, the formulas, even the right-click menus feel familiar from day one.
Tableau asks you to think differently: you're not filling cells, you're dragging fields onto "shelves" and letting VizQL build the query behind the scenes. It takes longer to click through at first, but the visual output often looks sharper with less manual formatting once you're past the learning curve.
Practical differences worth knowing before you commit:
- Power BI uses DAX for calculations; Tableau uses calculated fields and LOD (Level of Detail) expressions, which behave differently under the hood.
- Power BI connects natively to Excel, SharePoint, and Azure. Tableau ships with a broader native connector library out of the box (90+ sources).
- Excel-fluent analysts typically reach basic productivity in Power BI within 2-3 weeks; Tableau usually takes 4-6 weeks to reach the same comfort level [3].
- Power BI reports embed cleanly inside Teams and PowerPoint; Tableau dashboards embed better inside customer-facing web portals.
- Power BI ships monthly feature updates; Tableau's release cycle is slower but has historically been steadier for large enterprise rollouts.
Power BI vs Tableau salary in India and the US (2026)
Here's the part most people actually searched for.
The pattern across every 2026 salary report is consistent: the tool barely moves your pay past year two. SQL depth, data modeling skill, and your ability to explain a chart to a non-technical stakeholder matter far more than which logo is on your certificate. Professionals fluent in both Power BI and Tableau typically negotiate 10-20% higher than single-tool specialists, mainly because they fit into more teams and more job descriptions.
Which tool has more jobs right now?
Power BI currently shows roughly 22,000+ openings across Indian job boards versus 8,000+ for Tableau a gap driven by ecosystem lock-in, not tool quality.
- Roughly 9 out of 10 mid-size Indian companies already run Microsoft 365 or Azure, so Power BI slots into that stack at near-zero setup cost.
- Tableau tends to concentrate where Salesforce is already the CRM of choice, or where the analytics team pays extra for its visual depth.
- Globally, Power BI has overtaken Tableau in total job postings since 2023 and continues to widen the gap, while Tableau still dominates hiring at large tech and consulting firms [3].
If you're job-hunting in a heavy IT-services market, Power BI listings will outnumber Tableau listings by a wide margin. If your target employers are consulting firms (Deloitte, Accenture, EY) or Salesforce-native product companies, Tableau listings often carry more weight per opening.
Power BI vs Tableau: AI features in 2026
Both platforms lean hard into AI now, just in different directions.

- Power BI Copilot answers plain-language questions about your data and drafts DAX measures and report summaries automatically. It's tightly wired into Microsoft 365, so a question typed in Teams can pull straight from a Power BI dataset.
- Tableau Pulse / Einstein Analytics pushes metric alerts to Slack or email and automatically flags unusual shifts in your numbers genuinely useful for teams that don't want to open a dashboard every morning, though it's newer and still catching up on natural-language querying.
Neither AI layer replaces understanding your own data model both just make the surface-level questions faster to answer.
Power BI vs Tableau: which is better for beginners?
If you're picking your first BI tool, the data points toward Power BI for three concrete reasons:
- It's free to learn on your own laptop, indefinitely.
- The job market has roughly triple the openings in most regions outside pure-consulting hubs.
- Excel skills transfer almost directly, cutting the ramp-up time in half.
Add Tableau once you've built 4-5 real dashboards in Power BI and understand data modeling fundamentals at that point it becomes a genuine second skill instead of a competing one, and typically takes another 4-6 weeks to reach comfort.
Working professionals switching careers face a different calculus: if your target companies already run Salesforce, or you're aiming at consulting firms, start with Tableau instead. Match the tool to the job description you actually want, not the general internet consensus.
Common myths about power BI vs Tableau
A few mix-ups worth clearing up:
- Tableau is not automatically "more advanced." It's differently designed more visual flexibility, a leaner connector library out of the box.
- Power BI is not just for beginners. Senior BI engineers run enterprise-grade governance through Microsoft Fabric's semantic model layer.
- Knowing one tool doesn't disqualify you from the other's job listings. Recruiters increasingly care more about SQL and data modeling than the BI logo on your resume.
Final Verdict: Power BI vs Tableau 2026
Power BI wins on cost, job volume, and how fast a beginner becomes useful. Tableau wins on visual storytelling depth, massive-dataset performance, and specific consulting or Salesforce-heavy roles.
If you can only learn one tool right now, learn Power BI it's free, it's in more job descriptions, and Excel skills transfer directly. Add Tableau once you have a job and real project experience behind you. That sequencing gets you hired faster while leaving room to specialize later.