
Data analyst roadmap for 2027: skills, tools and projects in order
Data analyst roadmap for 2027 in seven stages: Excel and statistics, SQL, BI, Python, storytelling, domain and portfolio, each with a project and a proof.

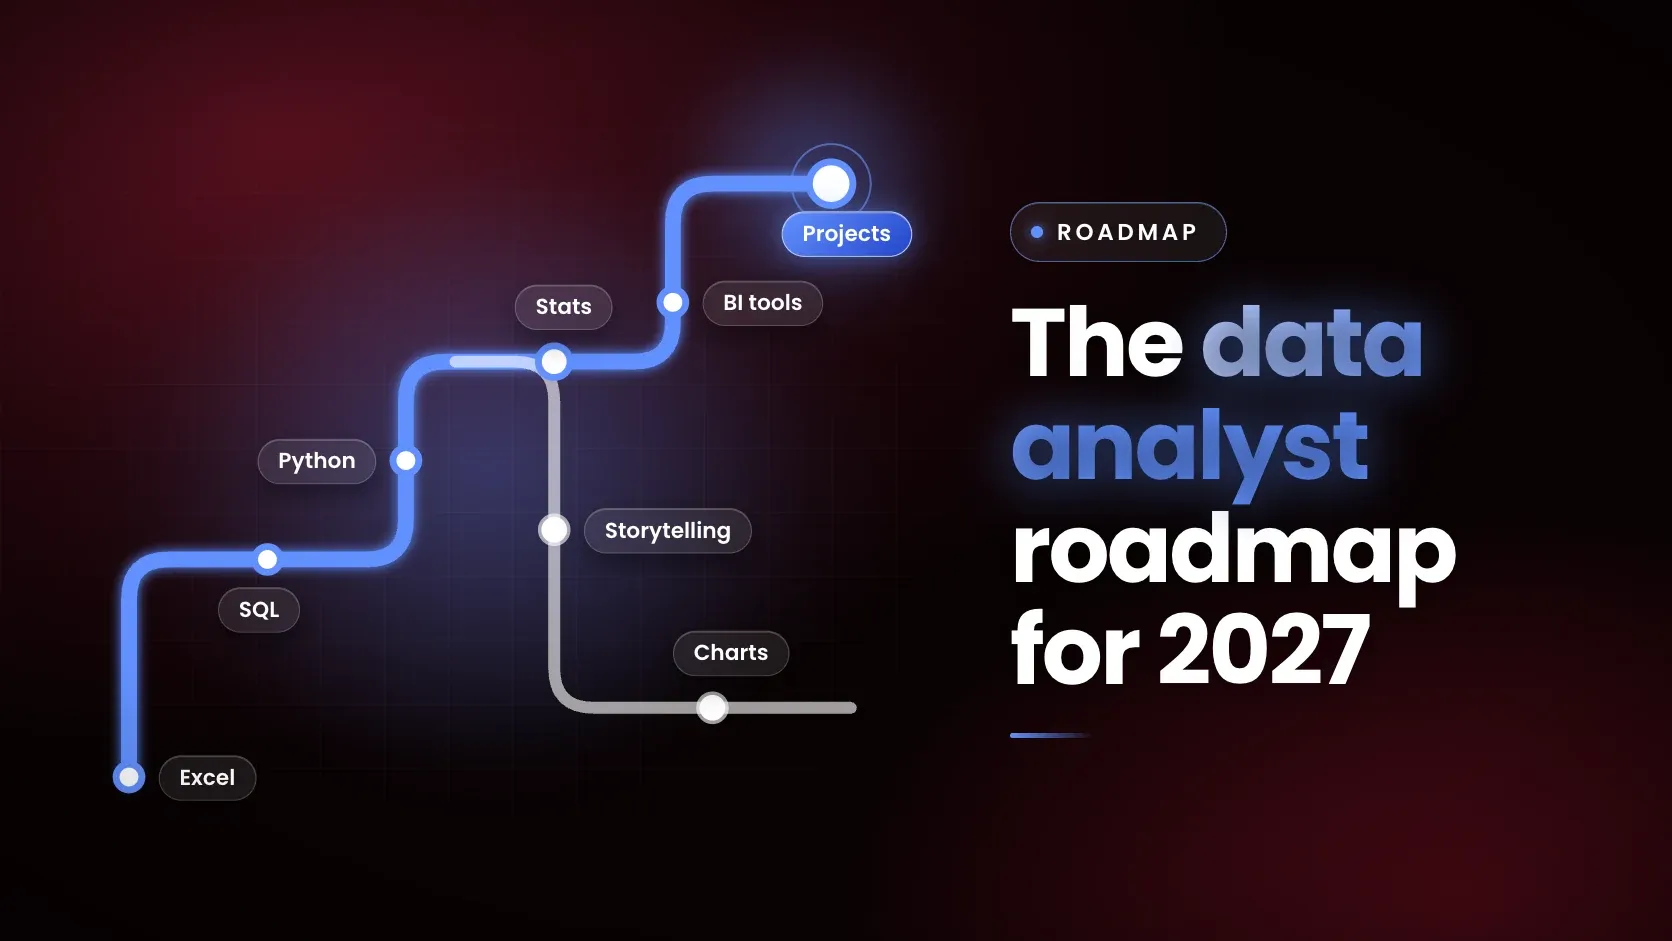
A data analyst roadmap for 2027 has seven stages: Excel and statistics, SQL, one BI tool, Python for analysis, storytelling, domain knowledge and a portfolio. Each stage ends with a proof of skill, such as a query that explains its row counts or a dashboard a non-technical reader can use. foundit's December 2025 Hiring Snapshot lists Python and SQL/Databases as the top two skills for 0 to 3 years' experience.
Which stages does a data analyst roadmap include?
The stages run from spreadsheets to a public portfolio, and each one has a project and a proof that signals readiness to move on. The table below lists all seven.
| Stage | Skills | Project | Proof to move on |
|---|---|---|---|
| 1. Excel and statistics | Formulas, lookups, PivotTables, descriptive statistics, confidence intervals | Clean and summarise a public dataset in a spreadsheet | A PivotTable answers a business question and the answer carries a confidence interval |
| 2. SQL | Joins, aggregates, GROUP BY, window functions | Analyse a three-table dataset (orders, customers, products) | A query with a join, a group and a window function, with row counts explained |
| 3. One BI tool | Data model, relationships, dashboards | A dashboard for one stakeholder question | A non-technical reader finds the answer without help |
| 4. Python for analysis | pandas, cleaning, groupby, notebooks, Git | A notebook on a messy dataset | The notebook reruns from top to bottom with no manual edits |
| 5. Storytelling | Charts, narrative, recommendation | A one-page readout of a finding | A reader can state the recommendation and the evidence |
| 6. Domain knowledge | The metrics of one sector | An analysis in that sector's own terms | The sector's key metrics can be named and explained |
| 7. Portfolio | README files, repositories, case write-ups | Three to four finished projects published | Each project states question, data, method and result |
What should come first: Excel, statistics and SQL?
Start with a spreadsheet and basic statistics, then move to SQL. Microsoft's documentation describes a PivotTable as a tool to calculate, summarise and analyse data that shows comparisons, patterns and trends, and says XLOOKUP finds a value in a table by row but is not available in Excel 2016 and Excel 2019. A statistics core follows the course outline of Penn State's STAT 800 notes: describing data, variability, sampling, confidence intervals and hypothesis tests, then correlation and regression. Cleaning comes early too, and is covered in data cleaning techniques in Excel, SQL and Python.
SQL is the second stage because analysis data is often held in databases. PostgreSQL's tutorial says an aggregate function computes a single result from many input rows and is most useful with GROUP BY, which is the base of summary queries. The next steps are joins, covered in SQL joins explained with examples, and window functions. Where the data lives also matters: a companion post on MongoDB vs MySQL explains when a document database replaces a relational one.
Hiring data points the same way. foundit's December 2025 Hiring Snapshot lists Python (22% share), SQL/Databases (18%), Java (16%), Cloud (12%) and Data Analysis (10%) as top skills for 0 to 3 years of experience. That is foundit's measure across all tracked early-career roles, not analyst postings alone. LinkedIn's Skills on the Rise 2026 for India, as reported by Storyboard18, places querying and database optimisation in its data and analytics cluster.
Which BI tool and which Python skills come next?
Pick one BI tool and learn it properly, then add Python. Power BI is used here as the example. Microsoft describes it as a business analytics platform, with Power BI Desktop as a Windows app for report development and the Power BI service as a cloud platform for publishing and sharing. Microsoft's getting-started steps offer the service in a browser as the alternative to Desktop, but signing up for the service needs a work or school email account, not a consumer address such as Gmail.
The workflow is similar across BI tools: connect and prepare data, model and combine it, build reports and dashboards, explore, then share.
Python adds repeatable cleaning, statistics and automation. These are the tools to learn for 2027, with versions as of 7 November 2026. The pandas 3.1.1 documentation, dated 4 November 2026, describes group by as splitting data into groups, applying a function to each group and combining the results, which is SQL's GROUP BY in Python. Its "10 minutes to pandas" page is written for new users. Python's Developer Guide lists Python 3.15 as first released on 9 October 2026, with 3.14, 3.13, 3.12 and 3.11 still receiving fixes and 3.10 at end of life.
The SQL and Python stages meet in experiment analysis. A conversion test needs a two-proportion test, a confidence interval and a sample size calculation.
How do storytelling and domain knowledge fit in?
Storytelling turns a result into a decision, and domain knowledge supplies the questions worth asking. LinkedIn's data and analytics cluster for India, as reported by Storyboard18, names data storytelling and data-driven decision-making next to querying. In the World Economic Forum's Future of Jobs Report 2025, published in January 2025, 79% of surveyed employers operating in India list analytical thinking among core skills of 2025.
A domain gives the work a vocabulary. foundit's June 2026 Hiring Snapshot lists Data Analysts/BI Developers (+26% year on year) among trending roles in banking and financial services global capability centres, but that figure applies to one sector only. Whether the target role is a data analyst or a business analyst changes which domain skills matter, and an earlier post compares the two in business analyst vs data analyst.
Which portfolio projects prove the skills?
A portfolio is three to four finished projects, each tied to one stage, and each published with a README. GitHub's documentation says a README is often the first thing a visitor sees and typically says what the project does, why it is useful, how to get started, where to get help and who maintains it. For an analyst, that translates to the question, the data, the method and the result.
Good projects follow the roadmap:
- A SQL project on a multi-table dataset, with the joins and window functions explained.
- A dashboard built for one named stakeholder question.
- A pandas notebook that cleans a messy file and ends with a recommendation.
- An experiment analysis using a test, an interval and a stated decision.
India's Open Government Data (OGD) Platform is a source of public datasets for practice. A data-quality step and a note on where the data came from make a project easier to trust. How that movement is organised is explained in what is ETL and how data pipelines work.
What does demand for data analysts in India look like?
Demand is mixed rather than uniformly strong, and the sources measure different things. The table below puts the named figures side by side with their publisher, period and scope.
| Publisher | Period | Reading |
|---|---|---|
| foundit | June 2026 | Online vacancies 9% below a year earlier; entry-level (0 to 3 years) demand at -6% |
| foundit | June 2026 | Data Analysts/BI Developers +26% year on year among trending roles in banking and financial services GCCs |
| Naukri JobSpeak | September 2026 | AI/ML roles up 20% year on year; overall hiring index up 2% |
| World Economic Forum | January 2025 projection to 2030 | India profile: 54% net growth for Data Analysts and Scientists, 17% for Business Intelligence Analysts |
| Indeed, as reported by IANS | January 2026 | 40% of data and analytics postings referenced AI, against 29% for software development |
Read together, they show selective hiring. foundit says hiring is narrowing to specialist, skill-led roles, so a visible portfolio matters more at entry level, where the tracker shows postings below a year earlier. The WEF figure is an employer-survey projection published in January 2025, not a count of jobs. The Indeed figure measures how often postings mention AI, not job losses.
How does AI change the roadmap for 2027?
AI tools change how the stages are practised, not their order. The Indeed reading above shows 40% of data and analytics postings referencing AI in January 2026, and 94% of surveyed employers in the WEF India profile expect AI and big data to be a skill of increasing use by 2030. NASSCOM's October 2026 study of 200 India-headquartered enterprises found that 78% confine agentic action to structured tasks with clearly defined end points, and that the majority require full human approval before any agentic action.
For a learner, that argues for using AI assistance inside each stage while keeping the ability to check the output: read the SQL, rerun the code, and confirm the numbers. The NASSCOM and Indeed report of May 2026 adds that 40% of employers prefer demonstrable AI skills or certifications over a degree, which is another reason to keep proof in a portfolio.
When does a roadmap not work?
A roadmap fixes an order, not a timetable or an outcome. No stage has a fixed duration, because the time depends on the starting point and the weekly hours available. Progress is better measured by the proof column in the table than by a calendar.
The demand figures also limit what any roadmap can promise. Vacancies, hiring indices and projections move month to month, differ by sector and publisher, and describe the market rather than any individual's chances. The stages build skills that employers list, which is different from a route to a particular job.
How does a structured programme fit into the roadmap?
A structured programme can supply order, feedback and projects, and the roadmap shows what to check for. The Analytics in the Age of AI programme (certificate title "Analytics with Agentic AI") is a live online programme by Vishlesan i-Hub Foundation, IIT Patna, with Masai as its ed-tech and implementation partner and an optional campus immersion at IIT Patna. It covers SQL, Python, BI tools, applied machine learning, generative AI workflows and agentic analytics through hands-on projects and a capstone.
Its modules include SQL and Working with Real Data, Python for Analytics, and Experimentation, BI and Executive Communication, and its listed topics include hypothesis testing and A/B test design.
Frequently asked questions
How long does it take to become a data analyst?
No fixed duration applies, because the time depends on the starting point and the weekly hours available. A better measure is the proof at each stage: a PivotTable answer with an interval, a query with explained row counts, a dashboard a stakeholder can read, and a notebook that reruns cleanly. Moving on when each proof is met keeps the pace honest.
Is SQL or Python more important for data analysts?
Both appear in hiring data, so learn SQL first and add Python. foundit's December 2025 early-career table lists Python at 22% share and SQL/Databases at 18% across all tracked roles, not analyst roles alone. SQL retrieves and summarises data where it is stored, and Python adds cleaning, statistics and automation on top.
What projects should a data analyst portfolio have?
Three to four finished projects that mirror the stages: a SQL analysis of several tables, a dashboard for one stakeholder question, a pandas notebook that cleans a messy dataset, and an experiment analysis with a stated decision. Each needs a README covering the question, data, method and result, as GitHub's documentation describes for project READMEs.
Is data analytics saturated in 2026?
The evidence is mixed. foundit's June 2026 tracker shows overall vacancies 9% below a year earlier and entry-level demand at -6%, which means competition for first roles is real. The same tracker lists Data Analysts/BI Developers at +26% among trending roles in banking and financial services GCCs. Selective hiring favours visible skills.
Which BI tool should a beginner learn first?
One tool, learned well, matters more than the choice itself. Power BI is a common starting point because Microsoft documents the full workflow from connecting data to sharing dashboards, though Power BI Desktop is a Windows app and signing up for the browser-based service needs a work or school email account. The skills of modelling, charting and explaining transfer to other BI tools.
Next step
Pick the stage that matches current skills, build its project, and write the proof into a README before moving on. The Analytics in the Age of AI programme covers SQL, Python, BI tools and a capstone for readers who want a structured route through the same stages. Skills that sit just beyond this roadmap, such as database choice and pipelines, are covered in the posts linked above.