
A/B testing explained: how analysts and product teams run experiments
A/B testing explained for analysts: the six steps, a sample size of 3,839 visitors per variant for a 10% to 12% lift, p-values, and the peeking trap.

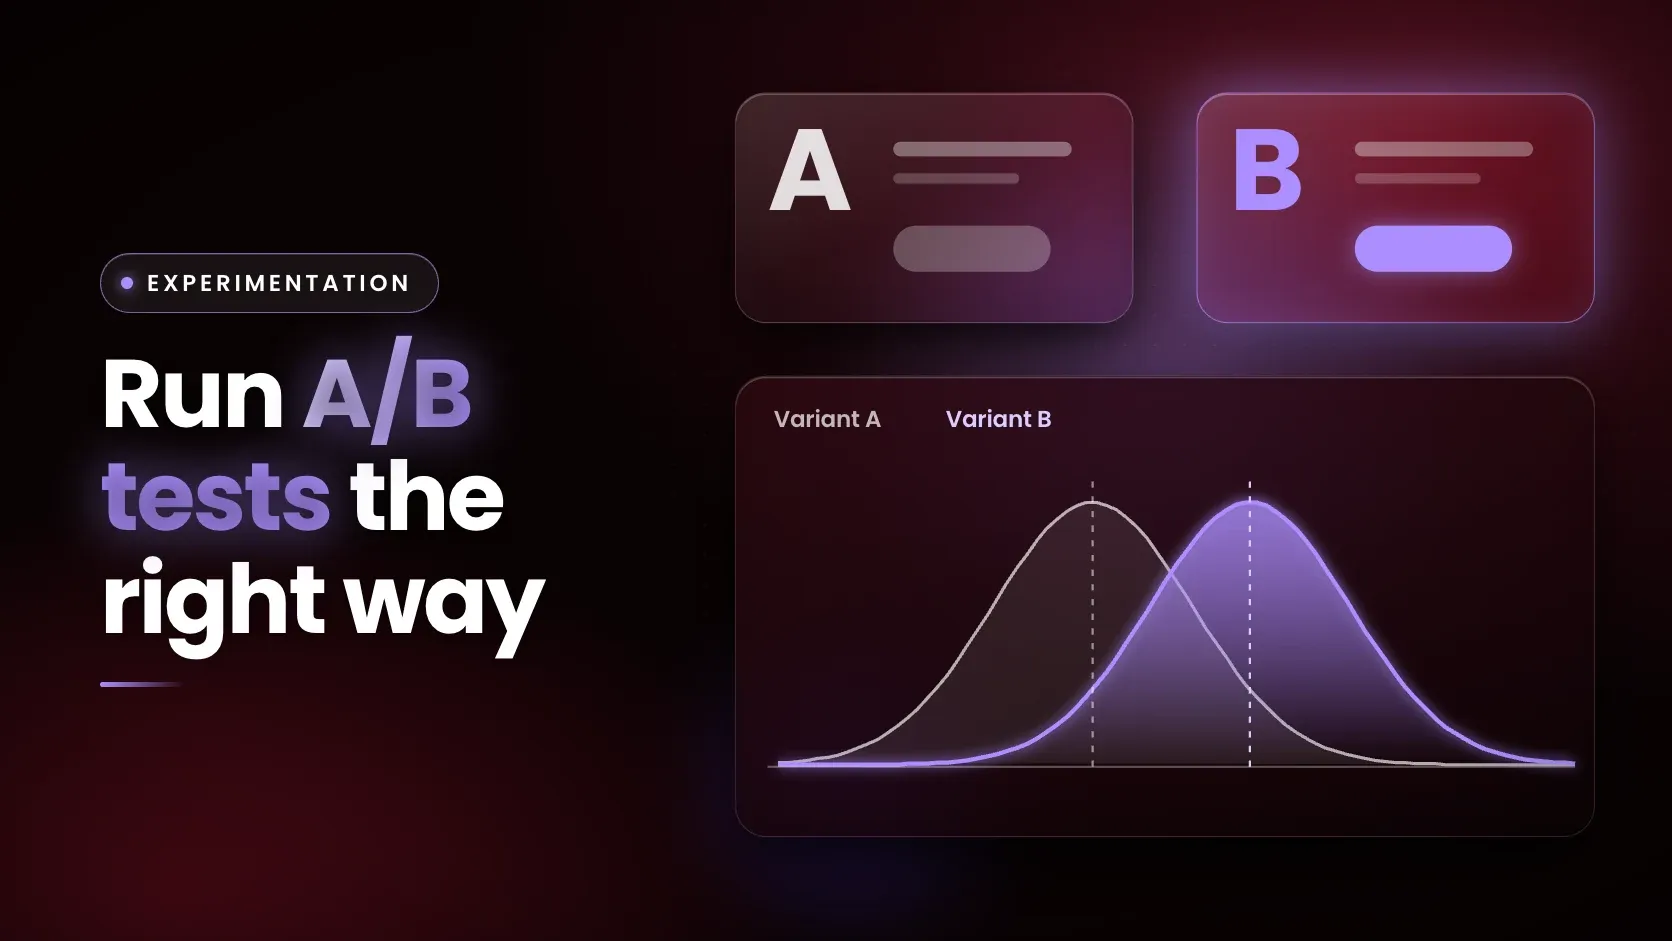
A/B testing is a controlled experiment in which visitors are randomly assigned to a control (A) or a treatment (B) and one pre-chosen metric is compared. Random assignment lets a difference be read as the effect of the change, not of who saw it. Microsoft researchers describe controlled experiments as the best scientific design for establishing cause and effect. A p-value and a confidence interval then quantify the evidence.
What is A/B testing?
A/B testing is the simplest controlled experiment on the web. Kohavi, Henne and Sommerfield of Microsoft, in a KDD 2007 paper, say users are randomly exposed to one of two variants, control (A) or treatment (B), and that the key is the word random: no factor can influence who sees which version. A single metric is derived for each variant, which the paper calls the Overall Evaluation Criterion, and analysis checks whether the difference is statistically significant.
If the experiment is designed and run properly, the only thing consistently different between the groups is the change itself. That is what turns a difference in the metric into evidence of cause. The same paper lists other names for the method: randomized experiments, split tests and Control/Treatment tests.
What are the steps of an A/B test?
An A/B test runs in six steps, and the decisions in the first four are made before any visitor is assigned. The table below uses a hypothetical product team in Pune testing a new checkout button.
| Step | Decision | Hypothetical example |
|---|---|---|
| 1. Hypothesis | What change, and what effect is expected | A clearer button raises checkout conversion |
| 2. Metric | One primary metric and who counts | Conversion rate of visitors who reach the cart page |
| 3. Randomisation | How visitors are assigned | Each visitor is assigned at random to A or B |
| 4. Sample size | Visitors needed per variant | About 3,839 per variant for a 10% to 12% lift |
| 5. Run time | How long the test runs | Whole weeks, never stopped early on a good-looking day |
| 6. Analysis | Test, interval and decision | Two-proportion z test and a 95% interval |
Two details from the KDD 2007 paper shape steps 2 and 5. Analysing only the users who could have seen the change, such as those who reached the checkout page, lowers variability, and conversion probability typically has a lower standard deviation than units purchased or revenue. The paper also recommends running a test for at least a week or two and then in multiples of a week, because weekend visitors often form different segments.
The metric itself is computed from logged events, and how raw events become a clean metric table is covered in what is ETL and how data pipelines work.
How do you decide the sample size for an A/B test?
Sample size depends on the baseline rate, the smallest lift worth detecting, the significance level and the power. For two proportions with equal group sizes, Dalhousie University's lecture notes give n = (p1(1 - p1) + p2(1 - p2)) (z_alpha/2 + z_beta)^2 / delta^2 per group, where delta is the difference between the two rates. Power is the probability of detecting a real difference, and the KDD 2007 paper says it is commonly set at 80 to 95%.
For a baseline conversion of 10%, a significance level of 5% (two-sided) and power of 80%, the required visitors per variant change sharply with the lift to detect.
| Lift to detect | Visitors per variant |
|---|---|
| 10% to 11% | 14,749 |
| 10% to 12% | 3,839 |
| 10% to 13% | 1,772 |
Halving the lift to detect nearly quadruples the sample, because delta is squared in the denominator. The Kohavi paper calls running underpowered experiments a common mistake. Other calculators use slightly different formulas: statsmodels' arcsine-based power routine gives 3,834.6 visitors for the 10% to 12% case, so results are quoted as "about" a figure and rounded up.
What does a worked A/B test result look like?
A worked result needs the counts, the rates, the test statistic, a p-value and an interval. In this hypothetical test, variant A converted 400 of 4,000 visitors and variant B converted 460 of 4,000.
| Measure | Variant A | Variant B |
|---|---|---|
| Visitors | 4,000 | 4,000 |
| Conversions | 400 | 460 |
| Conversion rate | 10.0% | 11.5% |
The two-proportion z test in Penn State's STAT 800 notes pools both groups under the null hypothesis that the rates are equal, and requires that each group's successes and failures all exceed five. Here they do (400, 3,600, 460 and 3,540). The code below reproduces the sample size and the result using only Python's standard library.
from math import sqrt, ceil
from statistics import NormalDist

z = NormalDist()

# Sample size per variant: baseline 10%, target 12%, 5% significance (two-sided), 80% power
p1, p2 = 0.10, 0.12
n = (p1 * (1 - p1) + p2 * (1 - p2)) * (z.inv_cdf(0.975) + z.inv_cdf(0.80)) ** 2 / (p1 - p2) ** 2
print("visitors per variant:", ceil(n))

# Result: A has 400 conversions from 4000 visitors, B has 460 from 4000
xa, na, xb, nb = 400, 4000, 460, 4000
pa, pb = xa / na, xb / nb
pooled = (xa + xb) / (na + nb)
z_stat = (pb - pa) / sqrt(pooled * (1 - pooled) * (1 / na + 1 / nb))
p_value = 2 * (1 - z.cdf(abs(z_stat)))
se = sqrt(pa * (1 - pa) / na + pb * (1 - pb) / nb)
print("z", round(z_stat, 3), "p", round(p_value, 4))
print("95% CI for the difference:", round(pb - pa - 1.96 * se, 4), "to", round(pb - pa + 1.96 * se, 4))
visitors per variant: 3839
z 2.166 p 0.0303
95% CI for the difference: 0.0014 to 0.0286| Statistic | Value |
|---|---|
| Difference in conversion rate | 1.5 percentage points |
| Pooled conversion rate | 10.75% |
| z statistic | 2.166 |
| Two-sided p-value | 0.0303 |
| 95% confidence interval for the difference | 0.14 to 2.86 percentage points |
What is statistical significance in A/B testing?
A result is statistically significant when its p-value is at or below the significance level chosen in advance, commonly 0.05. Penn State's STAT Online course describes the p-value as the probability, assuming the null hypothesis is true, of observing a more extreme test statistic in the direction of the alternative hypothesis than the one observed, and its STAT 800 notes say alpha is the preset level of significance while the p-value is the observed one. Alpha is also the probability of a Type I error, a false positive.
In the worked test, p = 0.0303 is below 0.05, so the difference is significant at the 5% level. The confidence interval adds the size: Penn State's STAT 800 notes interpret a 95% interval as being 95% confident that the population value lies between the bounds, and an interval for a difference that excludes 0 agrees with significance. Here the interval runs from 0.14 to 2.86 percentage points. The effect is probably positive, but its true size could be anywhere from almost nothing to almost three points.
The American Statistical Association's 2016 statement adds two cautions. A p-value is not the probability that a hypothesis is true, and it does not measure the size or importance of an effect. Decisions should not rest only on whether a p-value passes a threshold.
Where do A/B tests go wrong?
Four pitfalls change the answer of an A/B test without any arithmetic mistake.
Peeking is checking a running test repeatedly and stopping when it first looks significant. Johari and colleagues note that p-values and confidence intervals are wholly unreliable if users choose the sample size by continuously monitoring a test.
A short NumPy simulation shows the scale. It runs 20,000 A/A tests, in which both variants convert at 10% and nothing is different, and adds 500 visitors per variant at each of 10 looks.
import numpy as np
from statistics import NormalDist

rng = np.random.default_rng(2026)
sims, looks, per_look = 20000, 10, 500
a = rng.binomial(per_look, 0.10, size=(sims, looks)).cumsum(axis=1)
b = rng.binomial(per_look, 0.10, size=(sims, looks)).cumsum(axis=1)
n = per_look * np.arange(1, looks + 1)
pooled = (a + b) / (2 * n)
z = (b / n - a / n) / np.sqrt(pooled * (1 - pooled) * (2 / n))
significant = np.abs(z) > NormalDist().inv_cdf(0.975)
print("one look at the end:", significant[:, -1].mean())
print("stop at the first significant look:", significant.any(axis=1).mean())
one look at the end: 0.0503
stop at the first significant look: 0.1931Reading each test once, at the end, gave a false winner 5.0% of the time, close to the 5% the significance level allows. Declaring a winner at the first of the 10 looks with p below 0.05 gave a false winner 19.3% of the time.
Multiple comparisons inflate false positives. NIST's e-Handbook says repeating pairwise comparisons over all possible pairs does not work in general, because the overall significance level is no longer the one set for a single comparison. With 20 independent metrics tested at the 5% level and no real effects, the chance that at least one looks significant is 64%. The Bonferroni method divides alpha by the number of comparisons, 0.05 / 20 = 0.0025 in this case.
Sample ratio mismatch (SRM) means visitors split between variants in a different ratio than designed. Fabijan and colleagues, in a 2019 KDD paper, call it one of the most useful indicators of data quality problems and say ignoring it can make a bad change look good.
A chi-squared goodness-of-fit test compares observed counts with the planned split. For a hypothetical planned 50/50 split of 10,000 visitors that landed 5,200 in A and 4,800 in B, the statistic is 16.00 and p = 6.33e-05, far outside chance, so the result should not be trusted until the cause is found.
The novelty effect inflates early results for something new. Sadeghi and colleagues describe novelty as the desire to use new technology, which tends to diminish over time, and primacy as growing engagement as users adopt a change. The KDD 2007 paper says both imply some tests need to run for multiple weeks, and suggests computing the metric for new users only, since they are affected by neither.
What are the limits of A/B testing?
A/B testing answers a narrow question: did this change move this metric for these visitors during this period. Several limits follow from the evidence above.
- It needs traffic. A lift from 10% to 11% needs 14,749 visitors per variant, so small sites and small effects are hard to test.
- It measures the metric chosen. A significant conversion lift says nothing about returns, support calls or long-term value unless those are measured too.
- A significant result is not necessarily an important one. The ASA statement says a p-value does not measure the size or importance of an effect, which is why the interval matters.
- Short tests mislead. Day-of-week effects, novelty and primacy all argue for whole weeks, and the right length depends on the product.
A/A tests help check the setup. The KDD 2007 paper defines one as exposing both groups to exactly the same experience, and says the null hypothesis should be rejected about 5% of the time at a 95% confidence level. A rate far from that points to a fault in assignment or measurement.
How does A/B testing fit into a business analytics programme?
Experiment design sits between statistics and product decisions, so it appears in both analytics and product roles. The Certification Program in Business Analytics with Gen & Agentic AI is an online certification from BITS School of Management (BITSoM), offered in partnership with Masai, with live online classes and an optional campus workshop. It covers business analytics, SQL and Python, data visualization in Tableau and Power BI, machine learning, generative AI, prompt engineering and building AI agents, and its listed topics include basic statistics, hypothesis testing and A/B testing.
Frequently asked questions
What is A/B testing?
A/B testing is a controlled experiment where visitors are randomly assigned to a control (A) or a treatment (B) and one metric, such as conversion rate, is compared between them. Random assignment means a difference in the metric can be attributed to the change rather than to differences between the groups.
How do you decide the sample size for an A/B test?
Choose the baseline rate, the smallest lift worth detecting, the significance level and the power, then apply the two-proportion sample size formula. With a 10% baseline, a target of 12%, 5% significance and 80% power, about 3,839 visitors per variant are needed. Smaller lifts need far more visitors.
What is statistical significance in A/B testing?
Statistical significance means the p-value is at or below the significance level set in advance, usually 0.05. The p-value is the probability of getting the observed result if the null hypothesis, no real difference, is true. It does not give the probability that the change works, nor the size of the effect.
How long should an A/B test run?
Long enough to reach the planned sample size and to cover whole weeks. The KDD 2007 paper from Microsoft recommends at least a week or two and then multiples of a week, so day-of-week effects can be analysed. Tests of new features may need several weeks because of novelty and primacy effects.
What is peeking in A/B testing?
Peeking means checking results repeatedly while a test runs and stopping when the p-value first falls below 0.05. In the simulation above, 20,000 A/A tests with 10 looks produced a false winner 19.3% of the time, against 5.0% for a single look at the planned end.
What is sample ratio mismatch?
Sample ratio mismatch is a split between variants that differs from the planned ratio, such as 5,200 against 4,800 visitors in a design meant to be 50/50. A chi-squared goodness-of-fit test flags it. A 2019 KDD paper by Fabijan and colleagues treats it as a sign of data quality problems, so the experiment result should be set aside until the cause is found.
Next step
Rerun the code above with a baseline rate and lift from a product you know, and note how quickly the required sample grows as the lift shrinks. The Certification Program in Business Analytics with Gen & Agentic AI covers hypothesis testing and A/B testing alongside SQL, Python and dashboards. The wider skills path is in the data analyst roadmap for 2027.