What does a Data Analyst do, Exactly?
"Most data analysts spend around 80% of their time cleaning data. Why? Because of a simple truth in Machine learning; Better data beats fancier algorithms."

Discover the day-to-day responsibilities of a data analyst, from defining objectives and data collection to cleaning, analysis, and reporting.
Have you ever realized that when you buy a product, you get bombarded with recommendations for other similar products?
Or that you mostly get ads for products or services that you have a certain affinity to?
Or have you noticed the prices for an airline ticket increasing as you check it over and over again?
All of this happens because of an algorithmically driven process in place that is enriched through data. The people that oversee the whole process, from collecting this data, to stalking the user’s intent, to deriving conclusions are known as data analysts.
If we define it in a more generic way, 'A data analyst is someone who collects, cleans, and analyzes big unstructured data sets to solve business and real-world problems.'
They're the ones making sense of the quintillions of terabytes of data circulating all around us, be it the number of sales a particular ad triggered to the number of risks and frauds detected in the case of banking and insurance companies.
Basically, where there are numbers, there's data and when there's data, there are data analysts and data scientists.
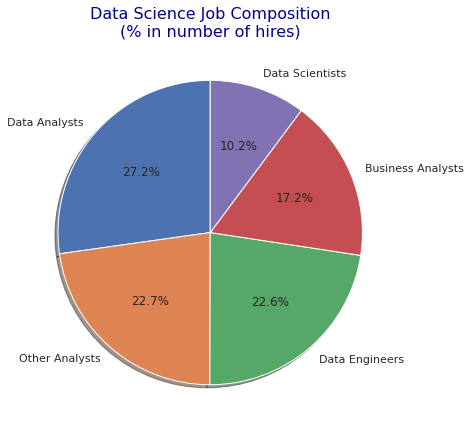
Demand for data analysts
Over the years, the demand for data analysts has been soaring. In fact, data scientists and data analysts have been consistently in the top 5 job postings in the last few years with an average salary of $55,057 in the US.
In India, there are 65,000+ data analyst job openings at present, according to LinkedIn.
Therefore, it's no news that a lot of youngsters are looking to break into the field of data. We've already talked about what skills you need and how you can get there in our previous article.
The rising demand for data analyst
The demand for data analysts has increased rapidly in recent years, reflecting the growing importance of data-driven decision-making across various industries. This can be attributed to several key factors:
Business Intelligence: Companies recognise that data-driven insights can lead to more informed decisions, improved efficiency, and a competitive edge. Data analysts play a pivotal role in providing these insights.
Emerging Technologies: The rapid development of data analytics tools and technologies, including machine learning and artificial intelligence, has created new opportunities for data analysts to harness the power of data.
Industry Diversity: The demand for data analysts extends beyond traditional sectors like finance and IT. Industries such as healthcare, e-commerce, marketing, and agriculture increasingly rely on data analysts to optimise operations and strategy.
Data Security and Compliance: As data privacy regulations become more important, organisations require data analysts to ensure data compliance and protect sensitive information.
Global Reach: The demand for data analysts is not limited to specific regions or countries. It is a global trend, making data analysis a highly sought-after skill worldwide.
Here, we'll be sneaking into the day-to-day work of a data analyst and how exactly they impact the industry.
Why does data analytics matter?
Data analytics matters because it's the aptest tool for decision-making.
Can we not make decisions without analytics?
Yes, we can make decisions based on empirical information and instincts, but that won't be the most scientific approach to it. That way our decision might come right once, but could also come wrong twice.
With data, we have evidence. It can act as trends for our present decisions and predictions for our future decisions. Decisions derived from analytics might not be 100% true all the time, but it's undoubtedly the best way there is.
And that's why it has wide implications in all fields of work today, from healthcare, agriculture, and weather forecasting to businesses, sports, risk detection, and advanced technologies. (Check out 5 real life applications of Data Analytics)
Yes! With analytics, we can not only increase business intelligence (future sales or marketing spending) but we can also predict climate change in the coming future.
With that being said, it's time now to take a look at the day-to-day operations/proceedings of a data analyst.
If we simply look at the job descriptions for data analysts, it generally entails the following responsibilities:
- Create, implement, and manage cutting-edge analytical systems that take complex issues and turn them into straightforward frameworks.
- Determine trends and development prospects by analyzing large, complicated data sets.
- Work closely with management to determine key performance indicators (KPIs) and business needs.
- Make reports that reflect best practices in data mining, analysis, and visualization.
- Define and execute data gathering and integration logic, choosing the best mix of techniques and tools from a predetermined technology stack to ensure the solution's maximum scalability and performance.
- As data models, measurements, and infrastructure are built, create and update documentation for these concepts.
Don't you worry! We won't leave you with a simple job description filled with jargon words.
Instead, we'll provide the mental mapping of an analyst, the journey they go through, and how they derive the results. After all, it all starts with the mind, isn't it?
1) Defining an objective/ question
2) Collecting data
3) Establishing data processes
3) Cleaning data
4) Conducting analysis
5) Producing reports
Let's understand them step-by-step:
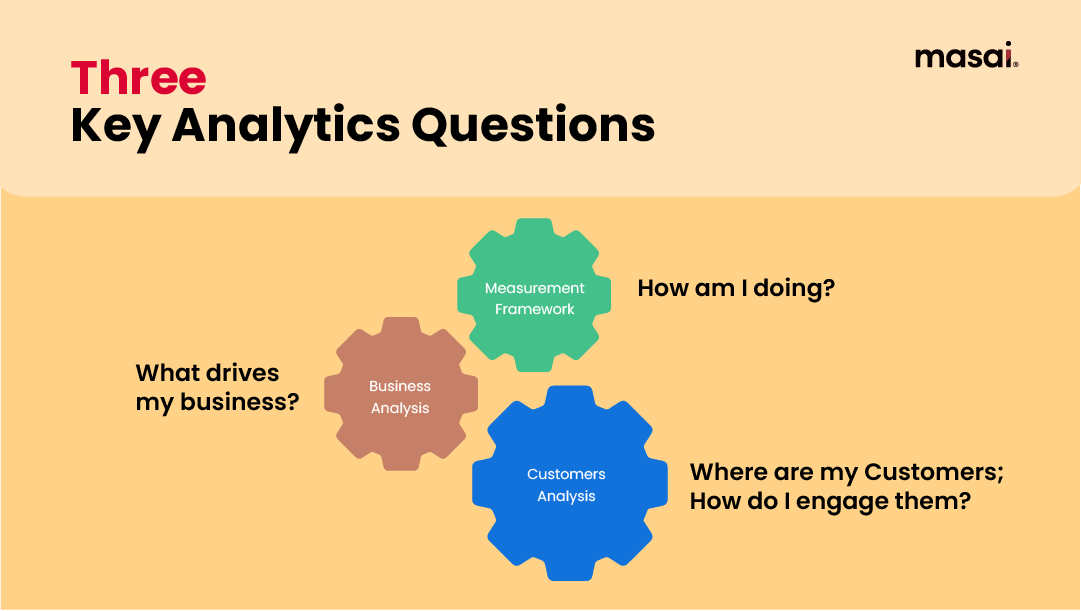
Defining the objective
First things first, a data analyst needs to identify the question and the objective of the analysis. In a way, this could be the trickiest part of the work they do.
An analyst needs to have a strong grasp of the business model, its inner workings, the way it functions, and its goals down the line.
Many a time, the problem that seems obvious to the eye might not be the real problem.
Let's say your company wants to boost its revenue but they're facing a certain roadblock. The senior management and product team decides to launch a new product suite to increase the average weight of consumption (AWOC).
They start spending resources on analyzing product demand and modeling a new product. On the other hand, with a bit more research from different angles, you the analyst realize that the real problem lies in the marketing of the existing products, resulting in low customer engagement and retention.
If you bring this insight to light, your company might find that investing in marketing training would boost revenue at much lower spending.
You could end up saving the company thousands of dollars, and possibly get appraisals from the senior management.
It's just a hypothetical case but it shows the importance of observing the data from different angles and identifying the right question. As an analyst, you need to keep all eyes open.
Sounds interesting? Let's move on to the next step.
Collecting Data
Data can come in two forms - Quantitative data (like marketing figures, and the number of customers gained) and Qualitative data (such as customer reviews).
Furthermore, depending on the type of company you're working in, data can either come as first-party data (information your organization has collected directly), second-party data (information you've obtained through another company's first-party data), or third-party data which can come from numerous sources by a third party.
The first step is to define data quality criteria to measure and check if the data is accurate, consistent, and reliable. In case the data is inaccurate, it can result in bad decisions and ineffective strategies by the company (as we saw in the example above)
Collection of data can be done in various ways including but not limited to, online surveys and polls, website analytics, social media engagement, existing customer database, and so on.
Establishing data processes
Setting up a process or a framework is vital to all kinds of work. Just like a football team's coach builds the formation and strategy for the game, a data analyst also needs a process for organizing data.
Oftentimes, the data is raw, complex, and unstructured and needs an analyst to break it down into relevant, and useful information. Analysts work with data engineers and architects in the team to execute process changes, update systems, and build better documentation techniques.
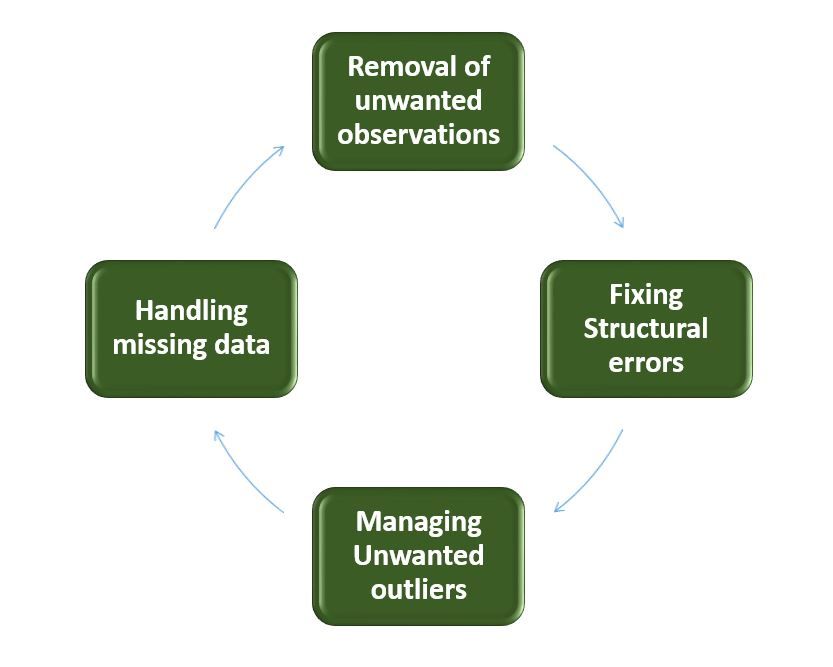
Data Cleaning
If you think that all analysts do is analyze, you are wrong. A major part of an analyst's workday goes into refining the data at hand. As tech writer Ajay Sangram mentions-
"Most data analysts spend around 80% of their time cleaning data. Why? Because of a simple truth in Machine learning; Better data beats fancier algorithms."
When huge chunks of data are generated, there’s a high probability that the raw dataset will have flaws and errors in it. Add to that the risk of data being outdated if it has been generated over time. To minimize these inefficiencies, a data analyst needs to first clean the data before using it in further processes.
With a cleaned dataset, implementing simple algorithms can give you great insights.
Data cleaning includes eliminating errors, duplicates, and outliers, removing undesirable data(those not relevant to your research), arranging the data in a more suitable way, and filling in gaps, among other activities.
After you've cleaned, you need to validate the data if it meets your requirements or not. Otherwise, you'll have to backtrack and have a go at it again through a different approach.
This is the iterative part of data analysis, but one that's absolutely essential. It's no surprise that companies would want people who can rigor through and clean the data before running algorithms.
Conducting Analysis
Now, it's finally time to run an analysis on the final data set you have. Different demands and situations require different types of data analysis. They all have specific purposes and can be used in tandem to produce a complete picture of data for strategy and decision-making.
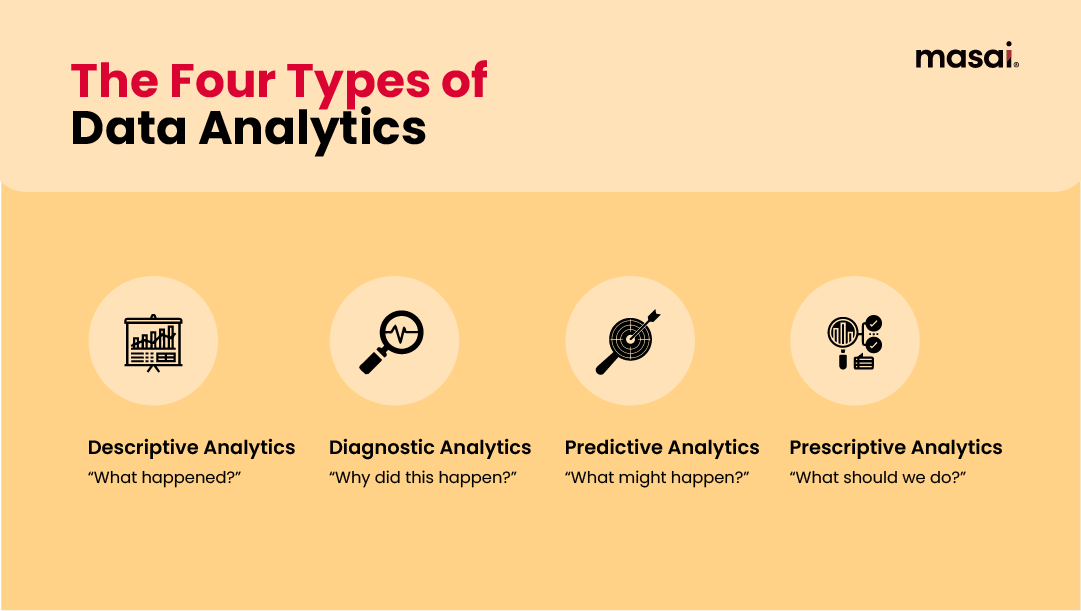
These are the four main types of analysis:
- Descriptive analytics
- Diagnostic analytics
- Predictive analytics
- Prescriptive analytics
Let’s look at them one-by-one.
Descriptive Analytics
It answers the question, "What happened?"
Descriptive analytics involves using current and past data to mark trends and patterns. It is the simplest form of analysis and your company would probably use it on a daily basis. It uses essential statistical tools like Excel, and data visualization tools like Tableau to help parse data and find relations between variables.
One example would be how the streaming platform Netflix gathers data on consumers' in-platform behavior and determine which series or movies to display on the home screen.
Diagnostic Analytics
It answers, "Why did something happen?"
Diagnostic analytics is the next logical step after you've used descriptive analytics to find trends.
It involves techniques such as drill-down, data discovery, data mining, and finding correlations.
One use case of diagnostic analysis is to decode customer behavior. Specifically, in the case of subscription-based services, it helps a great deal in customer retention. It explains the reason why departing customers cancel their subscriptions.
Predictive Analytics
It answers, "What's likely to happen in the future".
As the name suggests, it's used to predict future events across industries using historical data.
It can be either conducted manually or using machine learning algorithms.
Predictive analytics can be seen in many places, from your weekly weather forecast to early detection of allergic reactions in the health industry.
In our previous article '5 real-world examples of data analytics' we talked about how Walmart uses predictive analytics to hone loyalty programs for different customer segments and to forecast the demand for over 500 million products.
Prescriptive analytics
It is logically the last step in conducting an analysis. After you've described trends, found out the reason, and made data-driven predictions, the next step is to decide on the action plan. 'What should we do next' is the bottom line of prescriptive analytics.
It uses machine learning algorithms, specifically, "if and else" statements to process enormous amounts of data quickly and effectively.
However, it's important to note that everything can't be left to the algorithms. A major chunk of prescriptive analytics should involve human judgement and inference. We're the ones making the decisions, aren't we?
Producing Reports
Now, it's time to communicate your results to the stakeholders- could be your senior management or a third party. It's not as simple as just putting up some numbers and pointers on a blank paper.
This is where your data visualization skills come into play. How you're able to create lively narratives and stories from a given chunk of data will decide the direction of your company.
As an analyst, you will be creating graphs, pie charts, dashboards, documents, and presentations to deliver the narrative in an effective way.
This step can be easy to overlook, but it's as important as the analysis itself. You need to share your findings in a way that is less time-consuming and easily understandable to the non-technical people in your team.
Data Analyst Toolkit
The data analyst's toolkit is a versatile and powerful collection of tools and technologies designed to dissect, analyze, and derive meaningful insights from large amounts of data.
Excel for data manipulation, Python and SQL for data querying and scripting, and statistical packages for in-depth analysis are at the core of this toolkit. Analysts can use data visualization tools like Tableau and Power BI to transform raw data into visually appealing narratives.
Furthermore, machine learning libraries such as Scikit-Learn and TensorFlow enable analysts to create predictive models and uncover hidden patterns. Data analysts are well-equipped to handle the multifaceted challenges of today's data-driven world, providing organizations with invaluable insights for informed decision-making with this collection at their command.
Ready to start a career in data analytics?
Enterprises that employ data analytics are 23 times more likely than non-data-driven companies to beat competitors in terms of acquiring new customers, according to research by the renowned management consulting company McKinsey & Company.
Additionally, they were 19 times more likely to achieve above-average profitability and nine times more likely to outperform them in terms of customer loyalty metrics.
So, it clearly does make a difference. And it also makes sense for the companies to employ data analysts in good numbers.
But forget the companies, for now, we’re here to talk about you. Did the day-to-day roles and responsibilities mentioned above intrigue you? Would you like to see yourself analyzing big chunks of data and driving business decisions someday?
If it’s a ‘yes’, the next question is ‘how’?
Of course, you can go for a long-term conventional degree, there are several universities offering big data courses in India today.
But, another more viable option for you could be to go for a certificate program with placement assistance, as it’s more outcome-driven.
In the part-time data analytics course at Masai, you’ll receive training in all the tools and languages needed in a professional business analyst including MS-Excel, Python, SQL, Tableau, Statistics & probability, and parts of machine learning. It’s a 30-week course designed in a way that even absolute beginners can understand.
The unique part of our offering is that you don’t get to pay anything for the program unless and until you get placed with a CTC of INR 5 LPA.
So, what are you waiting for? Take the first step, check out this program, and make the best data-driven decision for your career.
Cheers!
Frequently Asked Questions
What is the role of a data analyst in a company?
A data analyst collects, cleans, and analyses large datasets to solve business problems. They provide insights and data-driven recommendations to support decision-making.
Why is data cleaning important in data analysis?
Answer: Data cleaning is vital because it ensures the accuracy and reliability of the data. Clean data leads to more accurate insights and better decision-making.
What skills are essential for a career in data analytics?
Key skills for a data analyst include data cleaning, statistical analysis, data visualisation, and proficiency in tools like Excel, Python, SQL, and Tableau.
What tools and technologies do data analysts typically use?
Data analysts commonly use a range of tools and technologies, including Excel, Python, SQL, Tableau, and statistical software. They may also employ machine learning libraries and data visualisation platforms to perform their analyses efficiently.
How does a data analyst's role differ from that of a data scientist?
While both roles involve working with data, data analysts primarily focus on cleaning, analysing, and interpreting data to provide insights for decision-making. On the other hand, data scientists delve deeper into complex data problems, often involving machine learning and predictive modelling, to develop data-driven solutions and algorithms.