
Financial modelling basics: the three-statement model explained
Financial modelling basics: how the income statement, balance sheet and cash flow link, with a worked 2-year model in Rs lakh that balances and a DCF.

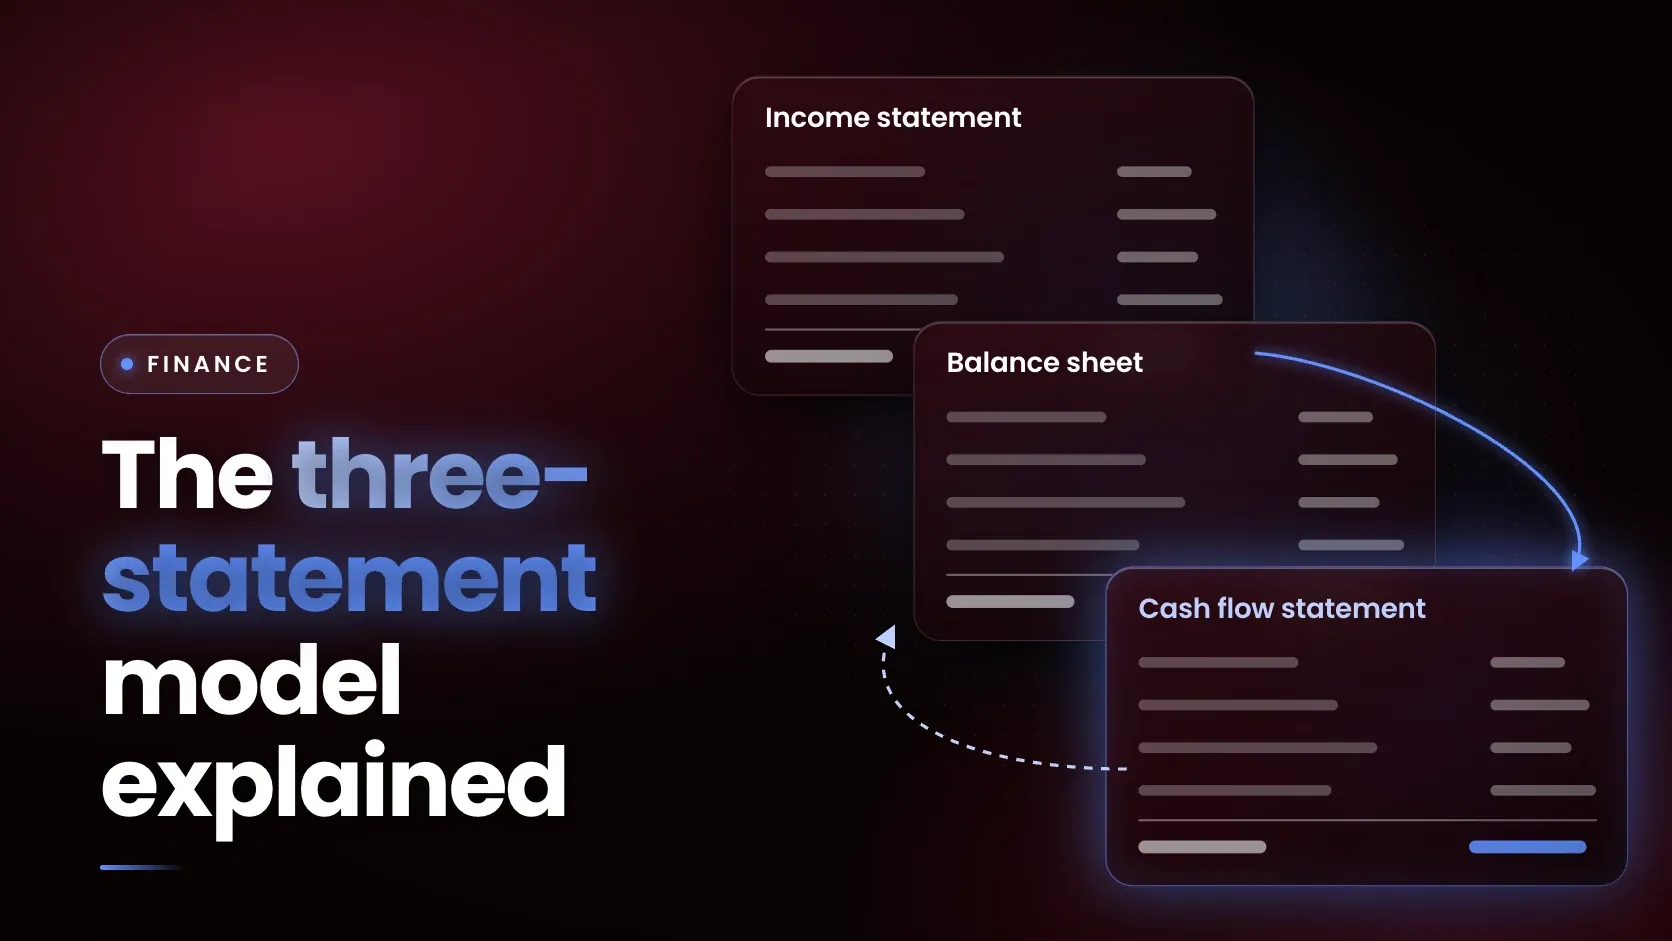
Financial modelling is the process of building structured representations of a company's financial performance to support analysis, forecasting and decision-making, as CFA Institute defines it. A three-statement model links the income statement, the balance sheet and the cash flow statement, so that a change in one assumption, such as revenue growth, flows through all three and the balance sheet still balances.
What is financial modelling, and which skills does it need?
CFA Institute adds that most financial models are built in spreadsheet software such as Excel and combine financial statements, operating assumptions and forecasting techniques. It lists investment banking, asset management, corporate finance and equity research as the areas that use them.
The skills follow from that description. A modeller needs enough accounting to read the three statements, spreadsheet fluency (the US Department of Labor's O*NET lists Excel among the hot technologies for financial and investment analysts), and habits of structure. CFA Institute's best practices are to separate assumptions from calculations, link schedules across statements and build models that are easy to audit.
Judgement matters as well, because CFA Institute's 2026 refresher reading on financial statement modelling also covers the behavioural biases that can shape a forecast. A guide to free online courses with certificates covers free spreadsheet training.
What does each of the three financial statements show?
The income statement shows performance over a period, the balance sheet shows what a company owns and owes at a date, and the cash flow statement shows how cash moved during the period. The IFRS Conceptual Framework of March 2018 gives the building blocks.
- An asset is a present economic resource controlled by the entity as a result of past events, and an economic resource is a right that has the potential to produce economic benefits.
- A liability is a present obligation to transfer an economic resource as a result of past events.
- Equity is the residual interest in the assets after deducting all liabilities.
- Income is an increase in assets or a decrease in liabilities that increases equity, apart from contributions by equity holders.
- Expenses are the reverse, apart from distributions to equity holders.
In India, Section 2(40) of the Companies Act, 2013 lists a balance sheet, a profit and loss account, a cash flow statement, a statement of changes in equity where applicable and explanatory notes as a company's financial statements, according to ICAI study material. The same material says a One Person Company, small company and dormant company may omit the cash flow statement.
IAS 7 and ICAI's Ind AS 7 material sort cash flows into operating, investing and financing activities. Under the indirect method, operating cash flow starts from profit and adjusts for non-cash items and for changes in inventories, receivables and payables.
How do the three financial statements link?
The statements link through one identity and a handful of transfers. The Conceptual Framework states the identity: total assets minus total liabilities equal equity, and equity changes by income minus expenses plus contributions minus distributions. Every row below is one transfer that keeps that identity true in the mini model that follows.
| Link | From | To | Rule in the mini model |
|---|---|---|---|
| Net profit | Income statement | Retained earnings on the balance sheet | Opening retained earnings plus net profit minus dividend |
| Depreciation | Income statement | Net fixed assets, and the cash flow statement | Reduces fixed assets; added back in operating cash flow because no cash leaves |
| Capital expenditure | Cash flow statement (investing) | Net fixed assets | Opening fixed assets plus capital expenditure minus depreciation |
| Working capital | Balance sheet (receivables, inventory, payables) | Cash flow statement (operating) | An increase in working capital reduces cash |
| Loan repayment | Cash flow statement (financing) | Term loan | Opening loan minus repayment; next year's interest uses the new balance |
| Dividend | Cash flow statement (financing) | Retained earnings | Reduces cash and retained earnings together |
| Closing cash | Cash flow statement | Cash on the balance sheet | Opening cash plus net change in cash |
How is a three-statement model built, step by step?
A model is built in nine steps, in an order that lets each statement feed the next one.
- Enter the last actual balance sheet as the opening position.
- Create an assumptions area that is separate from the calculations.
- Forecast revenue. CFA Institute's curriculum builds its model from a sales forecast.
- Forecast costs, depreciation, interest and tax down to net profit.
- Forecast the balance sheet items: receivables, inventory and payables from revenue, fixed assets from capital expenditure and depreciation, and the loan from repayments.
- Build the cash flow statement from net profit and the balance sheet changes.
- Feed the closing cash back to the balance sheet.
- Check that total assets equal total liabilities plus equity in every period.
- Run scenarios and sensitivities on the assumptions that matter most.
A hypothetical worked example
Take a hypothetical manufacturer. Every figure is invented, in Rs lakh, and the model covers two forecast years after an opening balance sheet at Year 0. Interest is charged on the opening loan balance, which avoids a circular reference.
| Assumption | Value |
|---|---|
| Revenue | 2,000 at Year 0, growing 10% a year |
| Cost of goods sold | 60% of revenue |
| Operating expenses | 20% of revenue |
| Depreciation | 80 a year |
| Capital expenditure | 100 a year |
| Interest | 10% of the opening loan |
| Tax | 25% of profit before tax |
| Receivables, inventory, payables | 15%, 10% and 5% of revenue |
| Loan repayment | 40 a year |
| Dividend | 25% of net profit |
| Income statement | Year 1 | Year 2 |
|---|---|---|
| Revenue | 2,200 | 2,420 |
| Cost of goods sold | 1,320 | 1,452 |
| Gross profit | 880 | 968 |
| Operating expenses | 440 | 484 |
| Profit before depreciation | 440 | 484 |
| Depreciation | 80 | 80 |
| Operating profit | 360 | 404 |
| Interest | 40 | 36 |
| Profit before tax | 320 | 368 |
| Tax | 80 | 92 |
| Net profit | 240 | 276 |
| Dividend | 60 | 69 |
| Balance sheet | Year 0 | Year 1 | Year 2 |
|---|---|---|---|
| Cash | 200 | 280 | 383 |
| Receivables | 300 | 330 | 363 |
| Inventory | 200 | 220 | 242 |
| Net fixed assets | 800 | 820 | 840 |
| Total assets | 1,500 | 1,650 | 1,828 |
| Payables | 100 | 110 | 121 |
| Term loan | 400 | 360 | 320 |
| Share capital | 500 | 500 | 500 |
| Retained earnings | 500 | 680 | 887 |
| Total liabilities and equity | 1,500 | 1,650 | 1,828 |
| Cash flow statement | Year 1 | Year 2 |
|---|---|---|
| Net profit | 240 | 276 |
| Add depreciation | 80 | 80 |
| Less increase in working capital | -40 | -44 |
| Cash from operations | 280 | 312 |
| Capital expenditure | -100 | -100 |
| Cash from investing | -100 | -100 |
| Loan repayment | -40 | -40 |
| Dividend paid | -60 | -69 |
| Cash from financing | -100 | -109 |
| Net change in cash | 80 | 103 |
| Opening cash | 200 | 280 |
| Closing cash | 280 | 383 |
The model passes both checks. Total assets of 1,650 and 1,828 equal total liabilities and equity in Years 1 and 2, and the closing cash of 280 and 383 equals the cash line on the balance sheet. Retained earnings in Year 1 are 500 plus net profit of 240 minus the dividend of 60, which is 680. Working capital, meaning receivables plus inventory minus payables, rises from 400 to 440, so the cash flow statement deducts 40.
How do assumptions and sensitivity change the result?
A sensitivity table recalculates one result under combinations of two assumptions, which is the scenario analysis CFA Institute lists among the core modelling techniques. The table below shows Year 2 net profit from the same model, in Rs lakh, as revenue growth and the cost of goods sold ratio change.
| Revenue growth | Cost of goods sold 58% | Cost of goods sold 60% | Cost of goods sold 62% |
|---|---|---|---|
| 5% | 277 | 244 | 211 |
| 10% | 312 | 276 | 240 |
| 15% | 349 | 310 | 270 |
The centre cell is the base case of 276. In this table a two-point change in the cost ratio moves profit about as much as a five-point change in growth, which tells a reader which assumptions deserve the most evidence. A founder drafting a first forecast should treat the growth rate as a hypothesis, as the guide to validating a startup idea explains.
How does a DCF fit into the model?
A discounted cash flow (DCF) valuation discounts each year's forecast cash flow at the cost of capital and adds a terminal value for the years beyond the forecast. Aswath Damodaran of NYU Stern gives terminal value under stable growth as next year's cash flow divided by the discount rate minus the stable growth rate, and says the stable growth rate cannot exceed the growth rate of the economy.
This model defines free cash flow as operating profit after tax, plus depreciation, minus capital expenditure, minus the increase in working capital. That gives 210 in Year 1 and 239 in Year 2. At a discount rate of 12% and stable growth of 4%, the terminal value at Year 2 is 239 times 1.04 divided by 0.08, which is 3,107.
| Item | Year 1 | Year 2 | Terminal value |
|---|---|---|---|
| Free cash flow or terminal value | 210 | 239 | 3,107 |
| Present value at 12% | 187.5 | 190.5 | 2,476.9 |
The present values add to 2,854.9 for the operating assets. Equity value follows Damodaran's bridge of adding cash and subtracting debt: 2,854.9 plus cash of 200 minus the loan of 400 gives 2,654.9. In Excel, =NPV(12%, 210, 239+3107) returns the same 2,854.9, because Microsoft's NPV function discounts the first value by one full period.
Terminal value is 86.8% of the total here, because the explicit forecast is only two years. The next table shows how far the result moves with the two key inputs.
| Discount rate | Growth 3% | Growth 4% | Growth 5% |
|---|---|---|---|
| 10% | 3,295 | 3,812 | 4,536 |
| 12% | 2,559 | 2,855 | 3,236 |
| 14% | 2,090 | 2,281 | 2,514 |
Across these nine cells the terminal value is between 82.4% and 91.4% of the total. Damodaran warns that small changes in the stable growth rate can change terminal value significantly, more so as it approaches the discount rate, and that analysts often use it to bend a valuation. If growth equals the discount rate, the denominator is zero and the formula fails.
What mistakes and limits should a modeller know about?
These seven errors are worth checking for first, because each one either breaks the balance check or quietly distorts the result.
- Forcing the balance sheet to balance with a plug figure instead of finding the missing link.
- Typing numbers inside formulas instead of keeping them in the assumptions area, which CFA Institute lists among its best practices.
- Getting a sign wrong, such as adding an increase in working capital instead of deducting it.
- Forgetting to add depreciation back in operating cash flow.
- Setting terminal growth at or above the discount rate, or above the economy's growth.
- Leaving a time-zero cash flow inside Excel's NPV function, which discounts it a year too far.
- Charging interest on an average loan balance without handling the circular reference it creates.
A model is a structured set of assumptions, not a prediction. The figures above are hypothetical, and they are not a valuation of any company or advice on any investment.
The layout also depends on the reporting framework. For companies reporting under IFRS Accounting Standards, IFRS 18, effective for annual periods beginning on or after 1 January 2027, replaces IAS 1 and adds an operating profit subtotal, while Indian companies reporting under Ind AS follow standards notified by the Ministry of Corporate Affairs, so a model should follow whichever framework the company uses.
Where does financial modelling fit in a finance certification?
Financial modelling sits on top of statement reading, spreadsheet skill and valuation basics.
The SPJIMR Certification in Finance and Financial Analysis is a mostly live online programme certified by SPJIMR, with Masai as implementation and learning support partner and an optional campus immersion at SPJIMR, covering finance fundamentals, financial statements, Excel for finance, budgeting, fintech and GenAI for finance workflows, and a capstone dossier. Its modules include Financial Statements and Performance, Excel for Finance and Reporting, and Budgeting and Financial Decisions, and its listed topics include scenario analysis, NPV and IRR.
For the career side, see the guides on financial analyst skills in demand and how to become a financial analyst in India.
Frequently asked questions
What is the three-statement model?
A three-statement model is a spreadsheet forecast that links the income statement, the balance sheet and the cash flow statement through formulas. Net profit feeds retained earnings and closing cash feeds the balance sheet, so one changed assumption updates all three statements.
How do the three financial statements link?
Net profit moves into retained earnings, depreciation reduces fixed assets and is added back in cash flow, working capital changes reduce or release cash, and closing cash becomes the balance sheet's cash line. The identity that holds throughout is total assets minus total liabilities equal equity.
What skills do you need for financial modelling?
Accounting knowledge to read the statements, Excel for building the model, and structure: assumptions kept apart from calculations, linked schedules and checks that others can audit. CFA Institute notes that most financial models are built in spreadsheet software such as Excel, and its reading also covers behavioural biases that affect forecasts.
What is the difference between the direct and indirect cash flow methods?
Both report operating cash flow. The direct method lists major classes of gross cash receipts and payments. The indirect method starts from profit and adjusts for non-cash items, accruals and deferrals. ICAI's Ind AS 7 material says the final conclusions under both methods are the same.
Is financial modelling the same as a DCF?
No. A DCF is one use of a model, valuing the cash flows it forecasts. The same three-statement model also supports forecasting and scenario analysis without valuing anything. A DCF adds two inputs of its own, a discount rate and a stable growth rate for the terminal value, and small changes in either can move the valuation a long way.
Next step
Rebuild the mini model in a spreadsheet, keep every assumption in one block, and break the balance check on purpose to see which link fails. The SPJIMR Certification in Finance and Financial Analysis page lists the modules that cover financial statements, Excel for finance and budgeting.