
DevOps engineer roadmap for 2027: skills, tools and projects
A DevOps roadmap for 2027 in ten stages, from Linux and Git to Kubernetes and Terraform, with DORA's five delivery metrics and a tested Python example.

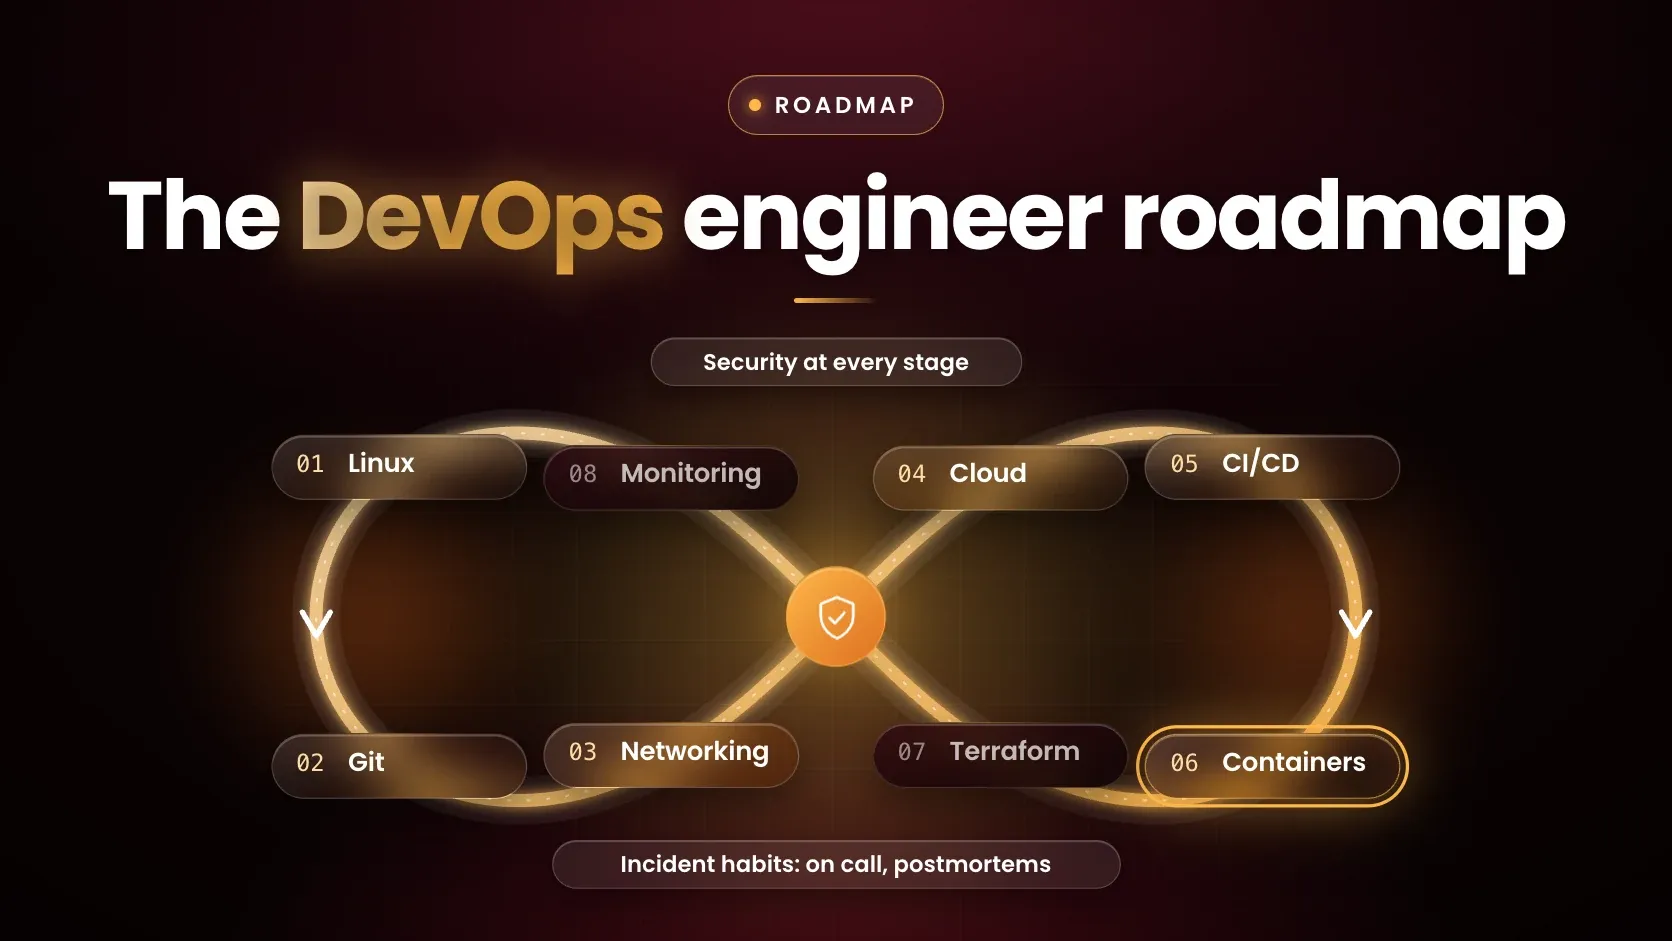
A DevOps roadmap for 2027 has ten stages: Linux and shell, Git, networking, one cloud, CI/CD, containers and Kubernetes, infrastructure as code, monitoring and logging, security basics and incident habits. Atlassian describes DevOps as a set of practices, tools and a cultural philosophy that automate and integrate the processes between software development and IT teams.
Last updated: 11 November 2026.
What does a DevOps engineer do?
A DevOps engineer builds and runs the delivery path that takes code from a developer's machine to production, and keeps it reliable once it is there. Microsoft Learn says DevOps combines development and operations to unite people, process and technology in application planning, development, delivery and operations, and that it coordinates formerly separate roles such as development, IT operations, quality engineering and security.
The role definitions join two skill sets. Microsoft describes a DevOps engineer as a developer or infrastructure administrator who also has expertise in enabling continuous delivery of value, and its DevOps Engineer Expert page asks for experience both administering and developing in Azure. Google Cloud says a Professional Cloud DevOps Engineer implements processes and capabilities across the systems development lifecycle while balancing reliability with delivery speed. Microsoft's definition treats coding and administration as part of the same job.
What are the stages of a DevOps roadmap?
The roadmap runs in ten stages, and each has the tools named in the vendors' own documentation, one project and a proof of skill. The table summarises them. Stages 3 and 4 are covered in the cloud engineer roadmap, so this page keeps them short.
| Stage | Tools named in official docs | Project | Proof before moving on |
|---|---|---|---|
| 1. Linux and shell | POSIX shell, OpenSSH | A script that checks a service and exits with an error code when it is down | Runs on a fresh Linux machine |
| 2. Git | Git, GitHub | A repository with branches, pull requests and one reverted change | History shows reviewed, small commits |
| 3. Networking | IP ranges, DNS, ports | A network plan for a web tier and a database tier | Each firewall rule has a reason |
| 4. One cloud | AWS, Microsoft Azure or Google Cloud | A virtual machine and a storage bucket with limited access | No shared long-lived keys |
| 5. CI/CD | GitHub Actions, Jenkins, GitLab CI/CD | A workflow that tests every pull request and deploys on merge | A failing test blocks the deploy |
| 6. Containers and Kubernetes | Docker, Kubernetes, Argo CD | An application in a container, run as a Kubernetes Deployment | A bad release is rolled back |
| 7. Infrastructure as code | Terraform, OpenTofu, Ansible | A network and a virtual machine created from files | Rebuilt from the files alone |
| 8. Monitoring and logging | Prometheus, OpenTelemetry | Metrics and an alert for the stage 6 application | The alert fires on a deliberate fault |
| 9. Security basics | OWASP Top 10 CI/CD Security Risks | Secrets kept out of the repository and out of pipeline logs | A review finds no stored credentials |
| 10. Incident habits | Google's SRE postmortem practice | A blameless write-up of a deliberate failure | Each action item has an owner |
What are the DORA metrics, and how are they calculated?
The DORA metrics are five software delivery performance measures published by DORA, the DevOps Research and Assessment programme: change lead time, deployment frequency, failed deployment recovery time, change fail rate and deployment rework rate. DORA describes itself as the largest and longest running research programme of its kind on the capabilities that drive software delivery and operations performance.
Older descriptions list four metrics. DORA's guide describes a shift from the original four keys to the current five-metric model and refers to the move from MTTR to failed deployment recovery time.
DORA defines them as follows:
- Change lead time is the time for a change to go from committed to version control to deployed in production.
- Deployment frequency is the number of deployments over a period, or the time between deployments.
- Failed deployment recovery time is the time to recover from a deployment that fails and needs immediate intervention.
- Change fail rate is the ratio of deployments that need immediate intervention, likely a rollback or a hotfix.
- Deployment rework rate is the ratio of deployments that are unplanned but happen because of an incident in production.
The first three measure throughput and the last two measure instability. The script below applies those definitions to a hypothetical log of five deployments over eight days:
from datetime import datetime as dt
from statistics import median

# hypothetical log: committed, deployed, needed_intervention, recovered, unplanned_incident_fix
D = [
    ("2026-11-02 09:00", "2026-11-02 15:30", False, None, False),
    ("2026-11-03 10:10", "2026-11-04 11:00", True, "2026-11-04 12:15", False),
    ("2026-11-05 14:00", "2026-11-06 10:00", False, None, False),
    ("2026-11-06 16:20", "2026-11-06 18:00", False, None, True),
    ("2026-11-09 09:30", "2026-11-09 17:30", False, None, False),
]
t = lambda s: dt.strptime(s, "%Y-%m-%d %H:%M")
hrs = lambda a, b: (t(b) - t(a)).total_seconds() / 3600

lead = [hrs(c, d) for c, d, *_ in D]
recovery = [hrs(d, r) for _, d, f, r, _ in D if f]
print("deployments in 8 days:", len(D))
print("median change lead time (h):", round(median(lead), 1))
print("change fail rate:", f"{sum(1 for x in D if x[2]) / len(D):.0%}")
print("failed deployment recovery time (h):", round(median(recovery), 2))
print("deployment rework rate:", f"{sum(1 for x in D if x[4]) / len(D):.0%}")
Run on Python 3.12.13, it printed:
deployments in 8 days: 5
median change lead time (h): 8.0
change fail rate: 20%
failed deployment recovery time (h): 1.25
deployment rework rate: 20%
The data is invented, so the numbers say nothing about any team. DORA's own cautions matter more than the arithmetic: the guide says the metrics suit one application or service at a time, that comparing a mobile app with a mainframe system can mislead, and that setting a metric as a goal invites gaming, citing Goodhart's law. It also says its research has repeatedly shown that speed and stability are not trade-offs.
How do CI/CD, containers and Kubernetes fit together?
Continuous integration and delivery automates the path from commit to release, while Docker and Kubernetes package and run what that path delivers. GitHub says GitHub Actions is a CI/CD platform that automates build, test and deployment pipelines, with workflows that build and test every pull request or deploy merged ones to production. GitHub's quickstart workflow is a YAML file that uses the keys on, jobs, runs-on and steps. Jenkins describes itself as the leading open source automation server, and GitLab documents its own GitLab CI/CD. Learn one in depth.
The CI/CD pipelines explainer walks through a GitHub Actions example.
Docker is an open platform for developing, shipping and running applications, and the Docker for beginners guide covers images and containers. Kubernetes documentation says Pods are the smallest deployable units of computing in Kubernetes, each a group of one or more containers with shared storage and network resources, and that a Deployment provides declarative updates for Pods and ReplicaSets. The Kubernetes releases page lists 1.37 as the latest release line, with 1.37.1 released on 15 September 2026. The Kubernetes explainer covers Pods, Deployments and Services step by step.
Argo CD is described in its documentation as a declarative, GitOps continuous delivery tool for Kubernetes. OpenGitOps lists four GitOps principles in version 1.0.0: the desired state is expressed declaratively, stored in a versioned and immutable way, pulled automatically by software agents and continuously reconciled. Learn the principles before the tool.
Which infrastructure as code and monitoring tools should you learn?
Learn one infrastructure as code tool and one monitoring stack, and be able to explain what each replaces. HashiCorp says Terraform lets you define cloud and on-prem resources in human-readable configuration files that you can version, reuse and share. The Terraform LICENSE file on GitHub is a Business Source License with IBM as licensor from version 1.6.0, which is why OpenTofu exists: it is a fork stewarded by the Linux Foundation, created in response to that licence change. The concepts transfer between them.
The Ansible documentation describes Ansible as open-source automation that reduces complexity and runs everywhere, which suits configuring machines once they exist.
Prometheus is an open-source systems monitoring and alerting toolkit that stores metrics as time series with labels and has a query language, PromQL. OpenTelemetry is an open source, vendor-neutral framework for generating, exporting and collecting traces, metrics and logs, and it is not a monitoring backend itself. A first monitoring project has three parts: a metric the application exposes, an alert rule on it, and a fault injected on purpose to prove the alert fires.
How do security and incident habits complete the roadmap?
Security basics start with the pipeline itself, because a pipeline can deploy anything. The OWASP Top 10 CI/CD Security Risks project lists ten risks, from CICD-SEC-1 Insufficient Flow Control Mechanisms to CICD-SEC-10 Insufficient Logging and Visibility, including Inadequate Identity and Access Management, Poisoned Pipeline Execution and Insufficient Credential Hygiene. Use the list as a review checklist for the stage 5 workflow.
Incident habits come last. Google's Site Reliability Engineering book says blameless postmortems are a tenet of SRE culture and that a blameless postmortem focuses on the contributing causes of an incident without blaming any individual or team. After the stage 8 fault, write one: what happened, what the alert showed, what fixed it, and which follow-up actions have owners.
Is there demand for DevOps skills in India?
India's hiring reports show DevOps demand, concentrated above the fresher band. foundit's Insights Tracker for June 2026, published in July 2026, lists DevOps Engineers at +29% year on year among trending roles in the IT sector of global capability centres.
Its December 2025 snapshot lists DevOps & Automation Tools at a 15% share of top skills for 4 to 6 years of experience and DevOps & Platform Engg. at 11% for 7 to 10 years, and its July 2026 snapshot, published in August 2026, lists DevOps Engineer at a 6.9% share of top roles for 4 to 6 years.
Tool usage points the same way. In the Stack Overflow Developer Survey 2026, among 10,889 respondents, Docker was used by 59.1%, Kubernetes by 26.0%, Terraform by 18.3%, Helm by 12.4% and Ansible by 12.0%. The reports above are strongest above the fresher band, so a beginner's evidence is the set of working projects in the table.
What are the limits of this roadmap?
A roadmap does not replace production experience. The professional certifications are experience-gated: Google Cloud's Professional Cloud DevOps Engineer recommends 3+ years of industry experience, and Microsoft's DevOps Engineer Expert requires an earlier Azure associate certification. The Linux Foundation's Certified Kubernetes Administrator is an online, proctored, performance-based exam of command-line tasks.
Tools also change quickly: Terraform's licence moved, DORA's metric set grew from four to five, and the version numbers above are as of 11 November 2026. DORA's guide warns against using its metrics as targets. Pay is not covered because pay varies with employer, city and experience.
Where does this roadmap fit in an AI and ML programme?
Certification in Artificial Intelligence and Machine Learning is an online programme from Vishlesan i-Hub, IIT Patna, delivered on Masai's online platform, that covers Python, machine learning, deep learning, generative AI and LLMs, agentic systems and deploying models to production. Its topics include version control with Git and GitHub, containerised cloud deployment, and logging, monitoring and alerting, and its last module is Production Deployment, MLOps and Capstone, which overlap with stages 2, 6 and 8 of this roadmap.
Frequently asked questions
What does a DevOps engineer do?
A DevOps engineer builds and operates the path that moves code from development to production: version control, automated testing and deployment, infrastructure defined as code, monitoring and incident response. Microsoft describes the role as a developer or infrastructure administrator with expertise in enabling continuous delivery, which is why both coding and administration skills count.
Do DevOps engineers need to code?
DevOps engineers need at least scripting skills. Microsoft describes a DevOps engineer as a developer or infrastructure administrator, and its DevOps Engineer Expert page asks for experience administering and developing in Azure. The Go project lists DevOps and site reliability among its use cases. A first language such as Python, plus shell, is enough to start.
How long does it take to become a DevOps engineer?
The time to become a DevOps engineer depends on the starting point, and the vendors set experience markers rather than timelines: Google Cloud recommends 3+ years for its Professional Cloud DevOps Engineer certification. Plan by stages passed, with a working project and a written proof for each stage, not by weeks.
What are the DORA metrics?
The DORA metrics are the software delivery measures published by the DevOps Research and Assessment programme: change lead time, deployment frequency, failed deployment recovery time, change fail rate and deployment rework rate. Older pages describe four; DORA's current guide lists five and says the metrics suit one application or service at a time.
Is Kubernetes required for DevOps?
Kubernetes is not the first requirement. In the Stack Overflow Developer Survey 2026, 59.1% of respondents used Docker and 26.0% used Kubernetes. Learn containers and CI/CD first, then Kubernetes concepts such as Pods and Deployments. The Certified Kubernetes Administrator exam is a hands-on test of command-line tasks.
Which certifications help a DevOps engineer?
Certifications that suit DevOps include AWS Certified DevOps Engineer - Professional (DOP-C02), Microsoft Certified: DevOps Engineer Expert (AZ-400), Google Cloud's Professional Cloud DevOps Engineer and the Linux Foundation's Certified Kubernetes Administrator. The first three are experience-gated, so a beginner should start with a cloud foundational certification and a deployed project.
Next step
Start with stages 1 and 2 this week: one shell script and one Git repository with a pull request. The Certification in Artificial Intelligence and Machine Learning page lists the MLOps and deployment modules for readers who want a guided route into production deployment, and the data engineer roadmap shows where pipelines and orchestration continue.