
Best Python libraries for data analysis in 2027: pandas to DuckDB
Python libraries for data analysis as of 11 November 2026: pandas 3.1.1, Polars 2.1.0, DuckDB 2.0.0 and seven more, with install lines and tested code.

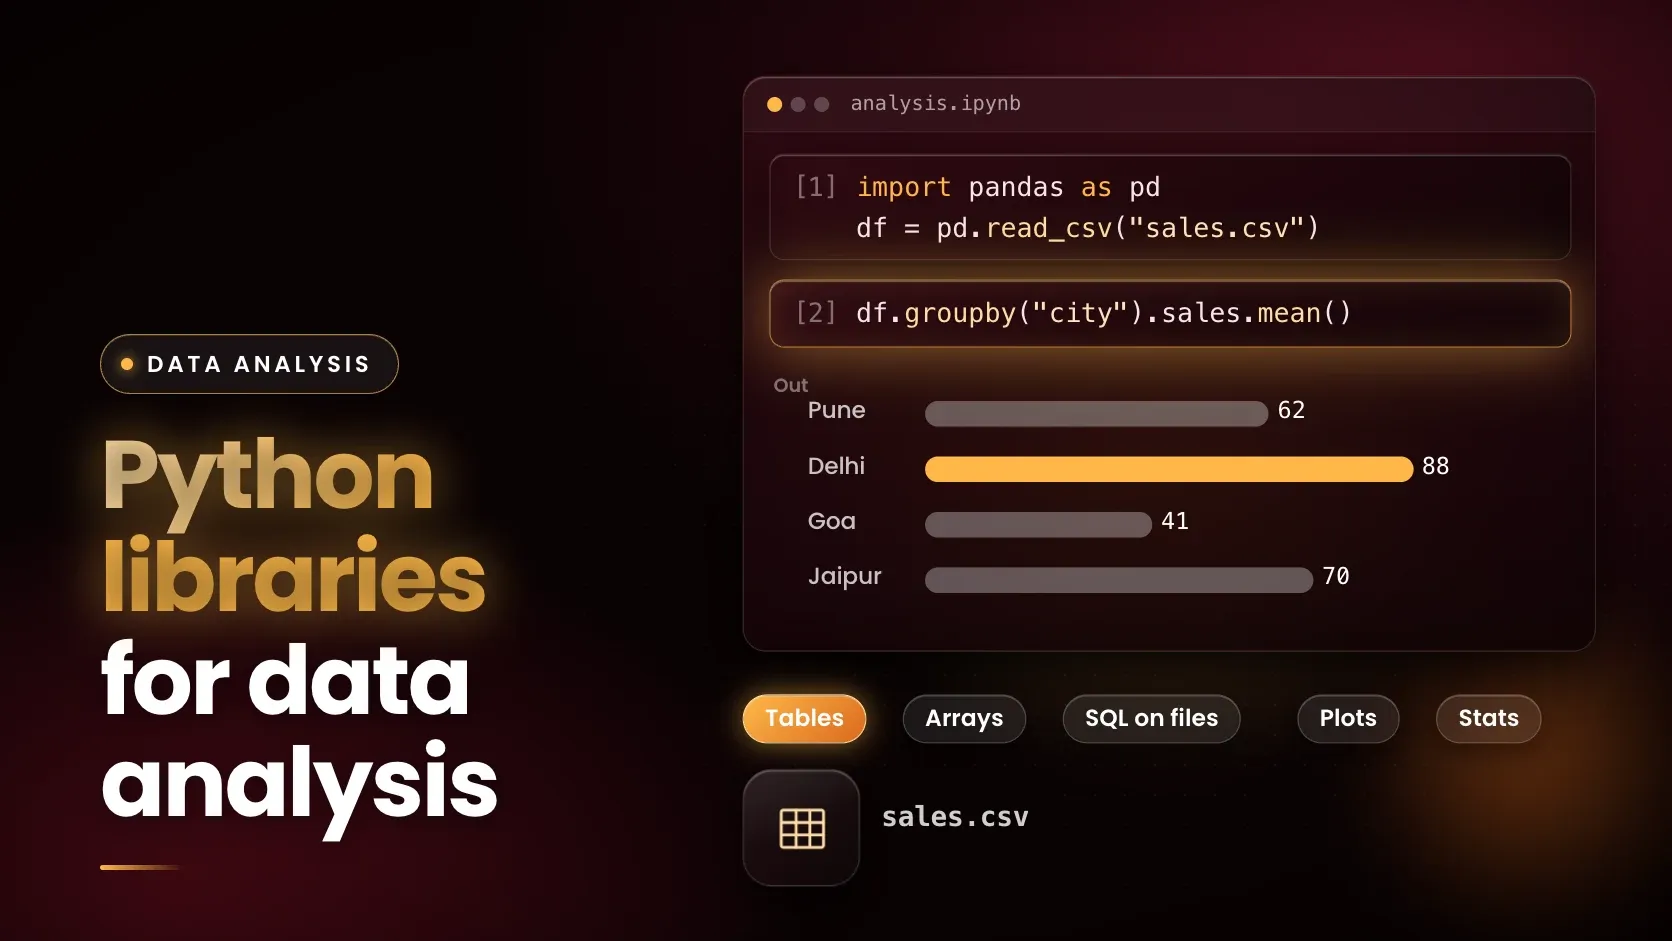
The main Python libraries for data analysis are pandas for tables, NumPy for arrays, Polars and DuckDB for larger or file-based work, Matplotlib, Seaborn and Plotly for charts, SciPy and statsmodels for statistics, and scikit-learn for modelling. As of 11 November 2026 the current PyPI releases are pandas 3.1.1, NumPy 2.5.4, Polars 2.1.0 and DuckDB 2.0.0. Each is listed below with its install line, one use and one limit.
Last updated: 11 November 2026.
Which Python libraries load, clean and query data?
pandas, NumPy, Polars and DuckDB cover loading, reshaping and querying data. pandas and Polars work on DataFrames, NumPy on arrays and DuckDB on SQL.
pandas
pandas is an open source Python library for data analysis and manipulation, and its home page lists version 3.1.1, released on 4 November 2026. Install it with pip install pandas and import it as import pandas as pd. A typical use is reading a CSV export and grouping it by region, as the worked example below does. The limit comes from the pandas scaling guide: pandas provides data structures for in-memory analytics, so data larger than memory is tricky, and some operations make intermediate copies.
NumPy
NumPy is the Python package for N-dimensional arrays and the numerical routines built on them, such as linear algebra and Fourier transforms. NumPy 2.5.4 reached PyPI on 10 October 2026. Install it with pip install numpy and import it as import numpy as np. A use is a column average: np.arange(6).reshape(2, 3).mean(axis=0) printed [1.5 2.5 3.5]. The limit is that every element of an array has the same type: np.array([1, "a"]).dtype printed <U21, so the number became text.
Polars
Polars is a DataFrame library for Python and SQL whose open-source engine is MIT-licensed. Polars 2.1.0 reached PyPI on 25 October 2026. Install it with pip install polars and import it as import polars as pl.
A use is a lazy query: pl.scan_csv builds a plan, nothing runs until collect(), and engine="streaming" processes data in batches when it does not fit in memory. The limits are habit and scope: Polars has no index, and some operations still fall back to the in-memory engine. On 5 November 2026 Polars announced that its commercial Polars Cloud became Polars Nanook; the open-source library keeps the name Polars.
DuckDB
DuckDB is an in-process analytical SQL database, so there is no server to install and it runs inside the Python process. DuckDB 2.0.0 was released on 21 October 2026 under the MIT licence as a long-term support version, which DuckDB says it supports until at least October 2027. Install it with pip install duckdb and import it as import duckdb.
A use is querying a file or a DataFrame directly: read_csv('orders.csv') reads a CSV by path, and a pandas DataFrame held in a variable can be queried as a table. The limit is writers: in the default mode one process can read and write a database, other processes can only read, and multi-process writing needs DuckDB's Quack protocol.
Which Python libraries chart, test and model data?
Matplotlib, Seaborn and Plotly draw charts, SciPy and statsmodels run statistical tests and regressions, and scikit-learn builds predictive models.
Matplotlib
Matplotlib describes itself as a comprehensive library for creating static, animated and interactive visualisations in Python. Version 3.11.2 reached PyPI on 11 September 2026. Install it with pip install matplotlib and import it as import matplotlib.pyplot as plt. A use is a line chart of monthly revenue for a report. The limit is two ways of working: the quick start says there are essentially two ways to use Matplotlib, creating Figures and Axes explicitly or letting pyplot manage them, so tutorials can look unlike each other.
Seaborn
Seaborn is a Python data visualisation library based on Matplotlib, with a high-level interface for statistical graphics such as relational, distribution and categorical plots. Install it with pip install seaborn and import it as import seaborn as sns. A use is a distribution plot or a category plot drawn from a table of data. The limit is currency: the newest Seaborn release on PyPI on 11 November 2026 is 0.13.2, uploaded on 25 January 2024, so any feature should be checked against the installed version.
Plotly
The Plotly Python library is an interactive, open-source plotting library that supports over 40 chart types. Version 7.1.0 reached PyPI on 15 September 2026 under the MIT licence. Install it with pip install plotly and import it as import plotly.express as px. A use is an interactive chart in a notebook or one exported as HTML. The limit is static export: saving a PNG or PDF needs Kaleido 1.0.0 or later, and Kaleido looks for a Chrome or Chromium browser already installed on the machine.
SciPy
SciPy provides algorithms for optimisation, integration, interpolation, differential equations and statistics on top of NumPy. SciPy 1.18.1 was released on 21 August 2026. Install it with python -m pip install scipy and import what is needed, such as from scipy import stats. A use is stats.linregress, which fits a line to two sets of measurements; on six hypothetical points it returned slope 1.909, intercept 4.2 and r 0.9988. The limit is scope: that function takes one predictor, so a regression with several predictors needs another tool such as statsmodels.
statsmodels
statsmodels is a Python module for estimating statistical models, running statistical tests and exploring data, with support for R-style formulas and pandas DataFrames. Release 0.15.0 is dated 27 August 2026. Install it with python -m pip install statsmodels and import it as import statsmodels.api as sm.
A use is ordinary least squares, which gave a 95% confidence interval of [1.778, 2.039] for the slope on the same six points. The limit is a beginner trap: OLS does not add an intercept by default, so skipping sm.add_constant produced one coefficient, 2.005, instead of the intercept 4.2 and slope 1.909.
scikit-learn
scikit-learn is a Python library of simple and efficient tools for predictive data analysis, built on NumPy, SciPy and Matplotlib and released under the BSD licence. Version 1.9.1 reached PyPI on 10 September 2026. Install it with pip install -U scikit-learn and import it as import sklearn, a different name from the package.
A use is fitting a predictive model, such as one that estimates next month's sales, on data cleaned in pandas. The limit is scope: its FAQ says deep learning and reinforcement learning are out of scope and points to TensorFlow, Keras and PyTorch.
What does each Python library do at a glance?
The table lists each library's job, its main limit, the latest release on PyPI and the minimum Python it needs, as of 11 November 2026.
| Library | Best for | Main limit | Latest on PyPI | Minimum Python |
|---|---|---|---|---|
| pandas | Tables held in memory | Data larger than memory is tricky | 3.1.1 (4 November 2026) | 3.11 |
| NumPy | Arrays and numerical routines | One data type per array | 2.5.4 (10 October 2026) | 3.12 |
| Polars | Lazy and streaming DataFrame queries | No index, some operations use memory | 2.1.0 (25 October 2026) | 3.11 |
| DuckDB | SQL on files and DataFrames | One writing process in embedded mode | 2.0.0 (21 October 2026) | 3.11 |
| Matplotlib | Static charts for reports | Two ways to use it | 3.11.2 (11 September 2026) | 3.11 |
| Seaborn | Statistical charts | Newest release is from January 2024 | 0.13.2 (25 January 2024) | 3.8 |
| Plotly | Interactive charts | Image export needs Kaleido and Chrome | 7.1.0 (15 September 2026) | 3.8 |
| SciPy | Scientific algorithms and tests | linregress takes one predictor | 1.18.1 (21 August 2026) | 3.12 |
| statsmodels | Regression with full statistics | Intercept must be added | 0.15.0 (27 August 2026) | 3.10 |
| scikit-learn | Predictive models | Deep learning is out of scope | 1.9.1 (10 September 2026) | 3.11 |
How do pandas, Polars and DuckDB answer the same question?
The three libraries return the same answer from the same CSV, with different syntax and slightly different column types. Take a hypothetical orders.csv of ten rows with order_id, region, status and amount, and ask for paid revenue and order count per region, highest first. The script below ran on Python 3.12.13 with pandas 3.1.1, Polars 2.1.0 and DuckDB 2.0.0.
import pandas as pd
import polars as pl
import duckdb

# Paid revenue and order count per region, highest first
df = pd.read_csv("orders.csv")
print(df[df["status"] == "paid"]
      .groupby("region", as_index=False)
      .agg(revenue=("amount", "sum"), orders=("order_id", "count"))
      .sort_values("revenue", ascending=False)
      .to_string(index=False))

print(pl.read_csv("orders.csv")
      .filter(pl.col("status") == "paid")
      .group_by("region")
      .agg(revenue=pl.col("amount").sum(), orders=pl.len())
      .sort("revenue", descending=True))

print(duckdb.sql("""SELECT region, SUM(amount) AS revenue, COUNT(*) AS orders
                    FROM read_csv('orders.csv') WHERE status = 'paid'
                    GROUP BY region ORDER BY revenue DESC"""))
The output was identical in content for all three, and different in layout and types.
region  revenue  orders
 North     3000       3
  West     2100       2
 South     1600       2
shape: (3, 3)
┌────────┬─────────┬────────┐
│ region ┆ revenue ┆ orders │
│ ---    ┆ ---     ┆ ---    │
│ str    ┆ i64     ┆ u32    │
╞════════╪═════════╪════════╡
│ North  ┆ 3000    ┆ 3      │
│ West   ┆ 2100    ┆ 2      │
│ South  ┆ 1600    ┆ 2      │
└────────┴─────────┴────────┘
┌─────────┬─────────┬────────┐
│ region  │ revenue │ orders │
│ varchar │ int128  │ int64  │
├─────────┼─────────┼────────┤
│ North   │    3000 │      3 │
│ West    │    2100 │      2 │
│ South   │    1600 │      2 │
└─────────┴─────────┴────────┘
North brought 3000 from 3 paid orders, West 2100 from 2 and South 1600 from 2. The type labels differ: Polars shows i64 for the sum and u32 for the count, and DuckDB shows int128 for the sum. That matters when results move between libraries. DuckDB can query the pandas DataFrame df by name, and the integer sums arrived back in pandas as floats:
print(duckdb.sql("SELECT region, SUM(amount) AS total FROM df GROUP BY region ORDER BY region").df()) region total
0 North 3500.0
1 South 1900.0
2 West 2500.0This query summed every status, so the totals differ from the paid-only figures above. Checking dtypes after a hand-off between libraries catches this kind of surprise.
Is Polars faster than pandas?
Polars's own benchmark page does not include pandas, so it cannot settle the question. That page compares Polars 2.0, DuckDB 2.0 and DataFusion 54 on PDS-H, a benchmark based on TPC-H with 22 queries, on an AWS machine with 16 vCPUs and 32 GB of memory, and at 10 GB it lists Polars at 3.22 seconds and DuckDB at 4.27 seconds. It is a vendor-run test of query engines, not a pandas comparison. The fair test for a real project is to time both libraries on the real file and the real query.
Which Python library should you choose by data size and skill?
Start with pandas for tables that fit in memory, add DuckDB when the question is already SQL, and reach for Polars or DuckDB when the data outgrow memory. The table keys the choice to the reader's situation.
| Situation | Start with | Reason |
|---|---|---|
| First analysis project, a CSV that fits in memory | pandas | Reads the file into a DataFrame and groups it |
| Comfortable with SQL, data in CSV or Parquet files | DuckDB | read_csv queries a file by path, no server |
| Data larger than memory | DuckDB or Polars | DuckDB spills to disk, Polars streams in batches |
| Coming from pandas, wanting lazy queries | Polars | Lazy API, streaming engine, no index |
| Numerical work on arrays | NumPy | N-dimensional arrays |
| Charts for a written report | Matplotlib with Seaborn | Static and statistical plots |
| Charts people can explore | Plotly | Interactive charts, HTML export |
| Tests, simple fits and regressions | SciPy or statsmodels | linregress for one predictor, OLS for more |
| Predictive models | scikit-learn | Tools for predictive data analysis |
Analysts weighing Python against query languages can also read the earlier comparison of SQL and Python for data analysts, and the step that comes before most of these libraries has its own guide in Data cleaning techniques in Excel, SQL and Python.
What are the limits of these libraries, and how should the choice stay honest?
The first limit is the Python version. pandas 3.1.1, Polars 2.1.0, DuckDB 2.0.0, Matplotlib 3.11.2 and scikit-learn 1.9.1 need Python 3.11 or later, while NumPy 2.5.4 and SciPy 1.18.1 need Python 3.12 or later. In a fresh environment on Python 3.9.6, pip install "pandas==3.1.1" failed with "No matching distribution found", and plain pip install pandas quietly installed pandas 2.3.3 with NumPy 2.0.2. Checking python3 --version first, and using a virtual environment, avoids that.
The second limit is change. DuckDB 2.0.0 is three weeks old as of 11 November 2026, the pandas home page still lists the 3.0.6 and 2.3.3 releases beside 3.1.1, and the Seaborn release list ends in January 2024. Versions, support windows and product names here are dated for that reason.
The third limit is judgement. These libraries compute what they are told, so a total that looks right still needs a check against a number worked out by hand. The route from raw data to a trusted result is laid out in the data analyst roadmap for 2027, and the dashboard side is covered in the list of BI and dashboard tools. Practice problems are listed in the post on coding practice platforms.
Where does the data analytics programme fit?
Learners who want structured practice with these libraries alongside SQL and AI tools can look at the Certification Program in Data Analytics with AI and Gen AI. It is an online programme from E&ICT Academy, IIT Roorkee, run with Masai as the implementation partner, with live sessions and an optional campus immersion, covering SQL, Python, Google Sheets, prompt engineering, LLM tools and agentic workflows with LangChain and CrewAI, and a capstone project. Its modules include Core Data Architecture & Analytical Foundations and Intelligence-Driven Wrangling & Visual Narratives.
Frequently asked questions
Which Python library is best for data analysis?
No single Python library is best for data analysis, because the libraries cover different jobs. pandas is the usual starting point for tables, NumPy handles arrays, Matplotlib, Seaborn and Plotly draw charts, SciPy and statsmodels cover statistics, and scikit-learn builds predictive models. Polars and DuckDB suit larger data or SQL on files. The criterion is the job and the data size.
Is Polars faster than pandas?
Polars's own benchmark page compares Polars with DuckDB and DataFusion rather than pandas, so it gives no direct pandas figure. Polars documents a lazy API and a streaming engine, and pandas documents in-memory analytics. Whether Polars is faster for a given task depends on the data and the query, so timing both libraries on the real file is the reliable test.
Do data analysts need to learn DuckDB?
Data analysts do not need DuckDB to start, because pandas covers loading, grouping and charting for tables that fit in memory. DuckDB becomes useful when the data sit in CSV or Parquet files and the question is easier to write in SQL, or when a query outgrows memory. DuckDB's documentation says it supports larger-than-memory workloads by spilling to disk, with listed limitations.
Which Python version does pandas 3 need?
pandas 3.1.1 needs Python 3.11 or later, according to its PyPI metadata, and NumPy 2.5.4 and SciPy 1.18.1 need Python 3.12 or later. On Python 3.9.6, pip install pandas installed pandas 2.3.3 instead of 3.1.1 without a warning, so the Python version should be checked before installing, preferably inside a virtual environment.
What is the difference between pandas and NumPy?
NumPy provides N-dimensional arrays in which every element has the same type, while a pandas DataFrame can hold a different type in each column, such as integers in one column and text in another. The Polars documentation notes that pandas by default stores data in NumPy arrays. NumPy suits numerical work on arrays, and pandas suits tables with named columns.
Next step
Run the worked example on a small CSV of your own and check the types each library reports. For structured practice with SQL, Python and AI-assisted analysis, the Certification Program in Data Analytics with AI and Gen AI page lists the modules and how the programme is delivered.