
15 Power BI Projects for Beginners to Add to Your Portfolio


If you're learning data analytics, you've probably heard the same advice everywhere: "don't just watch tutorials, build projects." That's especially true for Power BI, since the fastest way to prove you can turn raw data into a decision-ready dashboard is to show one, not describe one.
This guide explains what Power BI actually is, why recruiters care about it, and gives you 15 Power BI project ideas for beginners, organized by difficulty, that you can build this month and add straight to your portfolio.
What is Power BI?
Power BI is Microsoft's business intelligence tool for turning raw data into interactive dashboards and reports. You connect it to a data source (Excel, SQL databases, APIs, cloud warehouses), clean and shape that data with Power Query, model relationships between tables, write calculations using DAX (Data Analysis Expressions), and then build visuals bar charts, maps, KPI cards, decomposition trees - that let anyone explore the data without touching a spreadsheet.
In short: Power BI sits between raw data and the people who need to make decisions from it, replacing static monthly reports with live, filterable dashboards.
Why it's worth learning now: it's one of the two most in-demand BI tools (alongside Tableau) and usually cheaper for companies on Microsoft 365; it now includes a generative Copilot for natural-language querying, so analysts are expected to use AI inside BI tools, not just build static charts; and you can build a complete, visually impressive dashboard in a single weekend with free datasets, making it one of the fastest tools for building a visible portfolio.
Why build power BI projects, not just watch tutorials
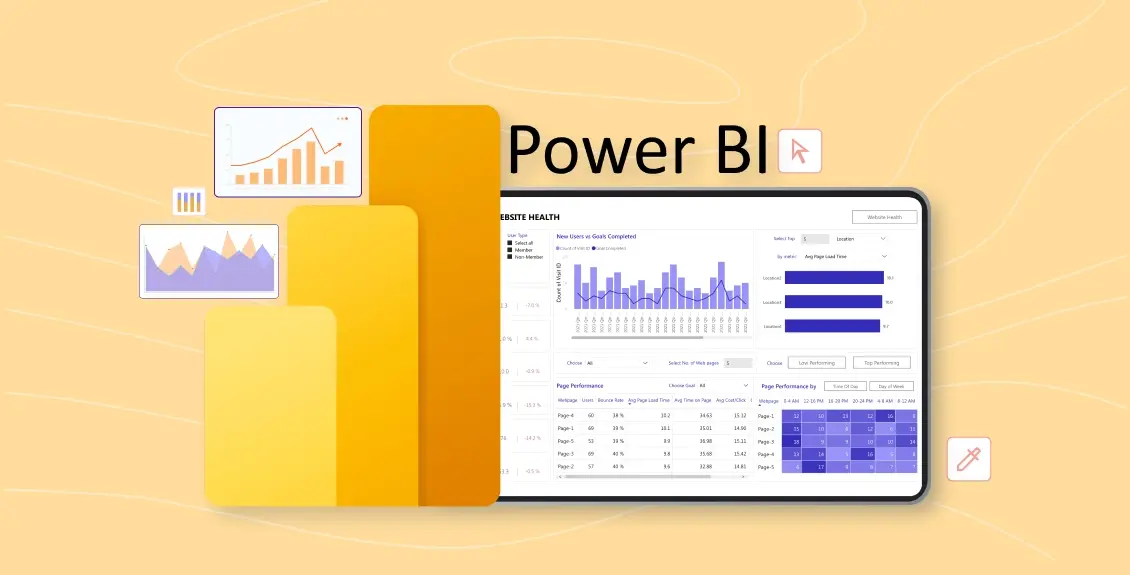
"Learned Power BI" on a resume means little. A link to a dashboard that answers a real business question - with a short write-up and a visible thought process, is proof you can do the job. Each project below lists a free dataset, the idea in plain language, and the core skills it demonstrates. Pick 3 to 5 that match your target role, not all 15 - a focused portfolio beats a crowded one.
5 Beginner-level power BI projects
Start here if you're new to Power BI. These teach core skills: importing data, basic DAX, and your first interactive dashboard.
1. Retail Sales Performance Dashboard Use a sample retail sales dataset to build a dashboard showing revenue, profit and units sold by product, region and month. Skills: Power Query cleaning, bar and line charts, slicers, basic DAX measures.
2. Customer Churn Overview Visualize churn rate by customer segment, contract type and tenure using a telecom or subscription churn dataset. Skills: calculated columns, heatmaps, conditional formatting.
3. COVID-19 Case Tracker Build a dashboard tracking cases, recoveries and deaths by country and date using a public COVID dataset. Skills: map visuals, line charts over time, date-table relationships.
4. Personal Finance / Expense Tracker Import your own (or a sample) bank statement export to track spending by category and month. Skills: data cleaning in Power Query, KPI cards, pie/donut charts.
5. Movie Ratings Explorer Use an IMDb or TMDB dataset to explore ratings by genre, year and runtime. Skills: histograms, scatter plots, filtering with slicers.
5 Intermediate-level power BI projects
These add DAX measures, multi-table relationships and storytelling for a business audience.
6. E-Commerce Sales & Profitability Dashboard Analyze an e-commerce dataset across products, regions and time, with DAX measures for profit margin and year-over-year growth. Skills: star-schema modeling, DAX time-intelligence functions.
7. HR Attrition and Workforce Analytics Explore an HR dataset to find attrition drivers by department, age group and tenure. Skills: what-if parameters, drill-through pages, HR-specific KPIs.
8. Marketing Campaign ROI Dashboard Use a marketing analytics dataset to compare campaign spend against conversions and revenue, calculating ROI and CAC. Skills: DAX measures for ROI/CAC, funnel visuals, cards.
9. Airline Delay and Cancellation Analysis Visualize flight delay patterns by airline, route and time of day using a public airline dataset. Skills: treemaps, decomposition trees, multi-page navigation.
10. Financial Statement Dashboard Turn a company's income statement and balance sheet into an interactive financial dashboard with ratio calculations. Skills: waterfall charts, DAX financial ratios, executive summary pages.
5 Advanced-level power BI projects
These push into AI-assisted analytics, external data connections and more complex modeling the kind of project that stands out in a portfolio.
11. AI-Assisted Sales Forecasting Dashboard Combine Power BI's built-in forecasting (or a Python/R visual) with historical sales data to project next-quarter revenue, then let Copilot generate a plain-language summary. Skills: forecasting visuals, AI-generated narratives, trend analysis.
12. Real-Time API-Connected Dashboard Connect Power BI to a live API (such as a weather, crypto or public transit API) to build a dashboard that refreshes automatically. Skills: Power Query API connections, scheduled refresh, real-time visuals.
13. Supply Chain and Inventory Dashboard Use a supply chain dataset to track inventory levels, supplier performance and stockout risk across warehouses. Skills: complex relationships, alerting via conditional formatting, KPI thresholds.
14. Clustering-Based Customer Segmentation Apply a clustering model (via Python integration or Power BI's built-in AI visuals) to group customers by behavior, then visualize the segments. Skills: AI visuals, embedded Python/R scripts, scatter/bubble charts.
15. Multi-Source Executive KPI Dashboard Combine data from three or more sources (for example, sales, marketing and support tickets) into one executive-level dashboard with drill-through detail pages. Skills: data integration across sources, row-level security, polished executive design.
Free datasets and how to showcase the work
Find datasets at: Kaggle (the largest free hub across industries), Microsoft's own Power BI sample datasets (financial, retail, HR), data.gov/data.gov.in for public-sector data, and GitHub repositories tagged "Power BI project."
To showcase a project well: add a short write-up (the business question, the data source, 2-3 key insights), include a screenshot or screen recording since not everyone downloads a .pbix file, publish to Power BI Service for a live clickable link when you can, and keep the DAX measures visible on GitHub or LinkedIn, not just the finished dashboard. Match projects to your target industry, a finance dashboard for a finance-analyst role beats a generic one.
Frequently Asked Questions
What is Power BI used for? Power BI is used to connect to data sources, clean and model that data, and build interactive dashboards and reports that let business teams explore trends and KPIs without needing to write code.
Is Power BI good for beginners? Yes. Power BI has a visual, drag-and-drop interface for building charts and a free desktop version, which makes it one of the more approachable BI tools to start learning, even with no coding background.
How many Power BI projects do I need for a portfolio? Three to five well-documented projects, each tied to a different skill, say more than ten shallow ones. Quality and a clear write-up matter more than volume.
Do I need to know DAX to build Power BI projects? Basic DAX (SUM, AVERAGE, calculated columns) is enough for beginner projects. Learn time-intelligence and more complex measures progressively as you move to intermediate and advanced builds.
Is Power BI or Excel better for a beginner portfolio? Excel suits quick, static analysis. Power BI is built for interactive, shareable dashboards, and most data analyst job descriptions ask for it (or Tableau) by name, making it the stronger portfolio choice.
How long does a beginner Power BI project take? A focused project (one dataset, one business question, 3-5 visuals) usually takes a weekend. Advanced, multi-source or AI-assisted builds can take one to two weeks.
Can Power BI projects help me get a data analyst job? Yes, when they're built around real business questions and documented well. Hiring managers look for evidence you can turn a messy dataset into a clear, decision-ready dashboard, exactly what a strong portfolio project shows.
Final Thoughts
Power BI rewards builders over readers. Pick three projects from this list that match the role you want, document your thinking as you go, and publish them somewhere visible. That's a stronger signal to a recruiter than any certificate alone, though pairing a portfolio with a structured, mentor-led analytics program can help you build these skills faster and with feedback along the way.
Datasets and tool references in this guide are accurate as of September 19, 2026. Always check a dataset's license before using it in a public portfolio piece.